


World Economic Forum
Information design and consulting for global issues
I am a long-term consultant for the World Economic Forum. My tasks range from strategic consultations to the design of interactive information visualization and print graphics.
Global risk reports
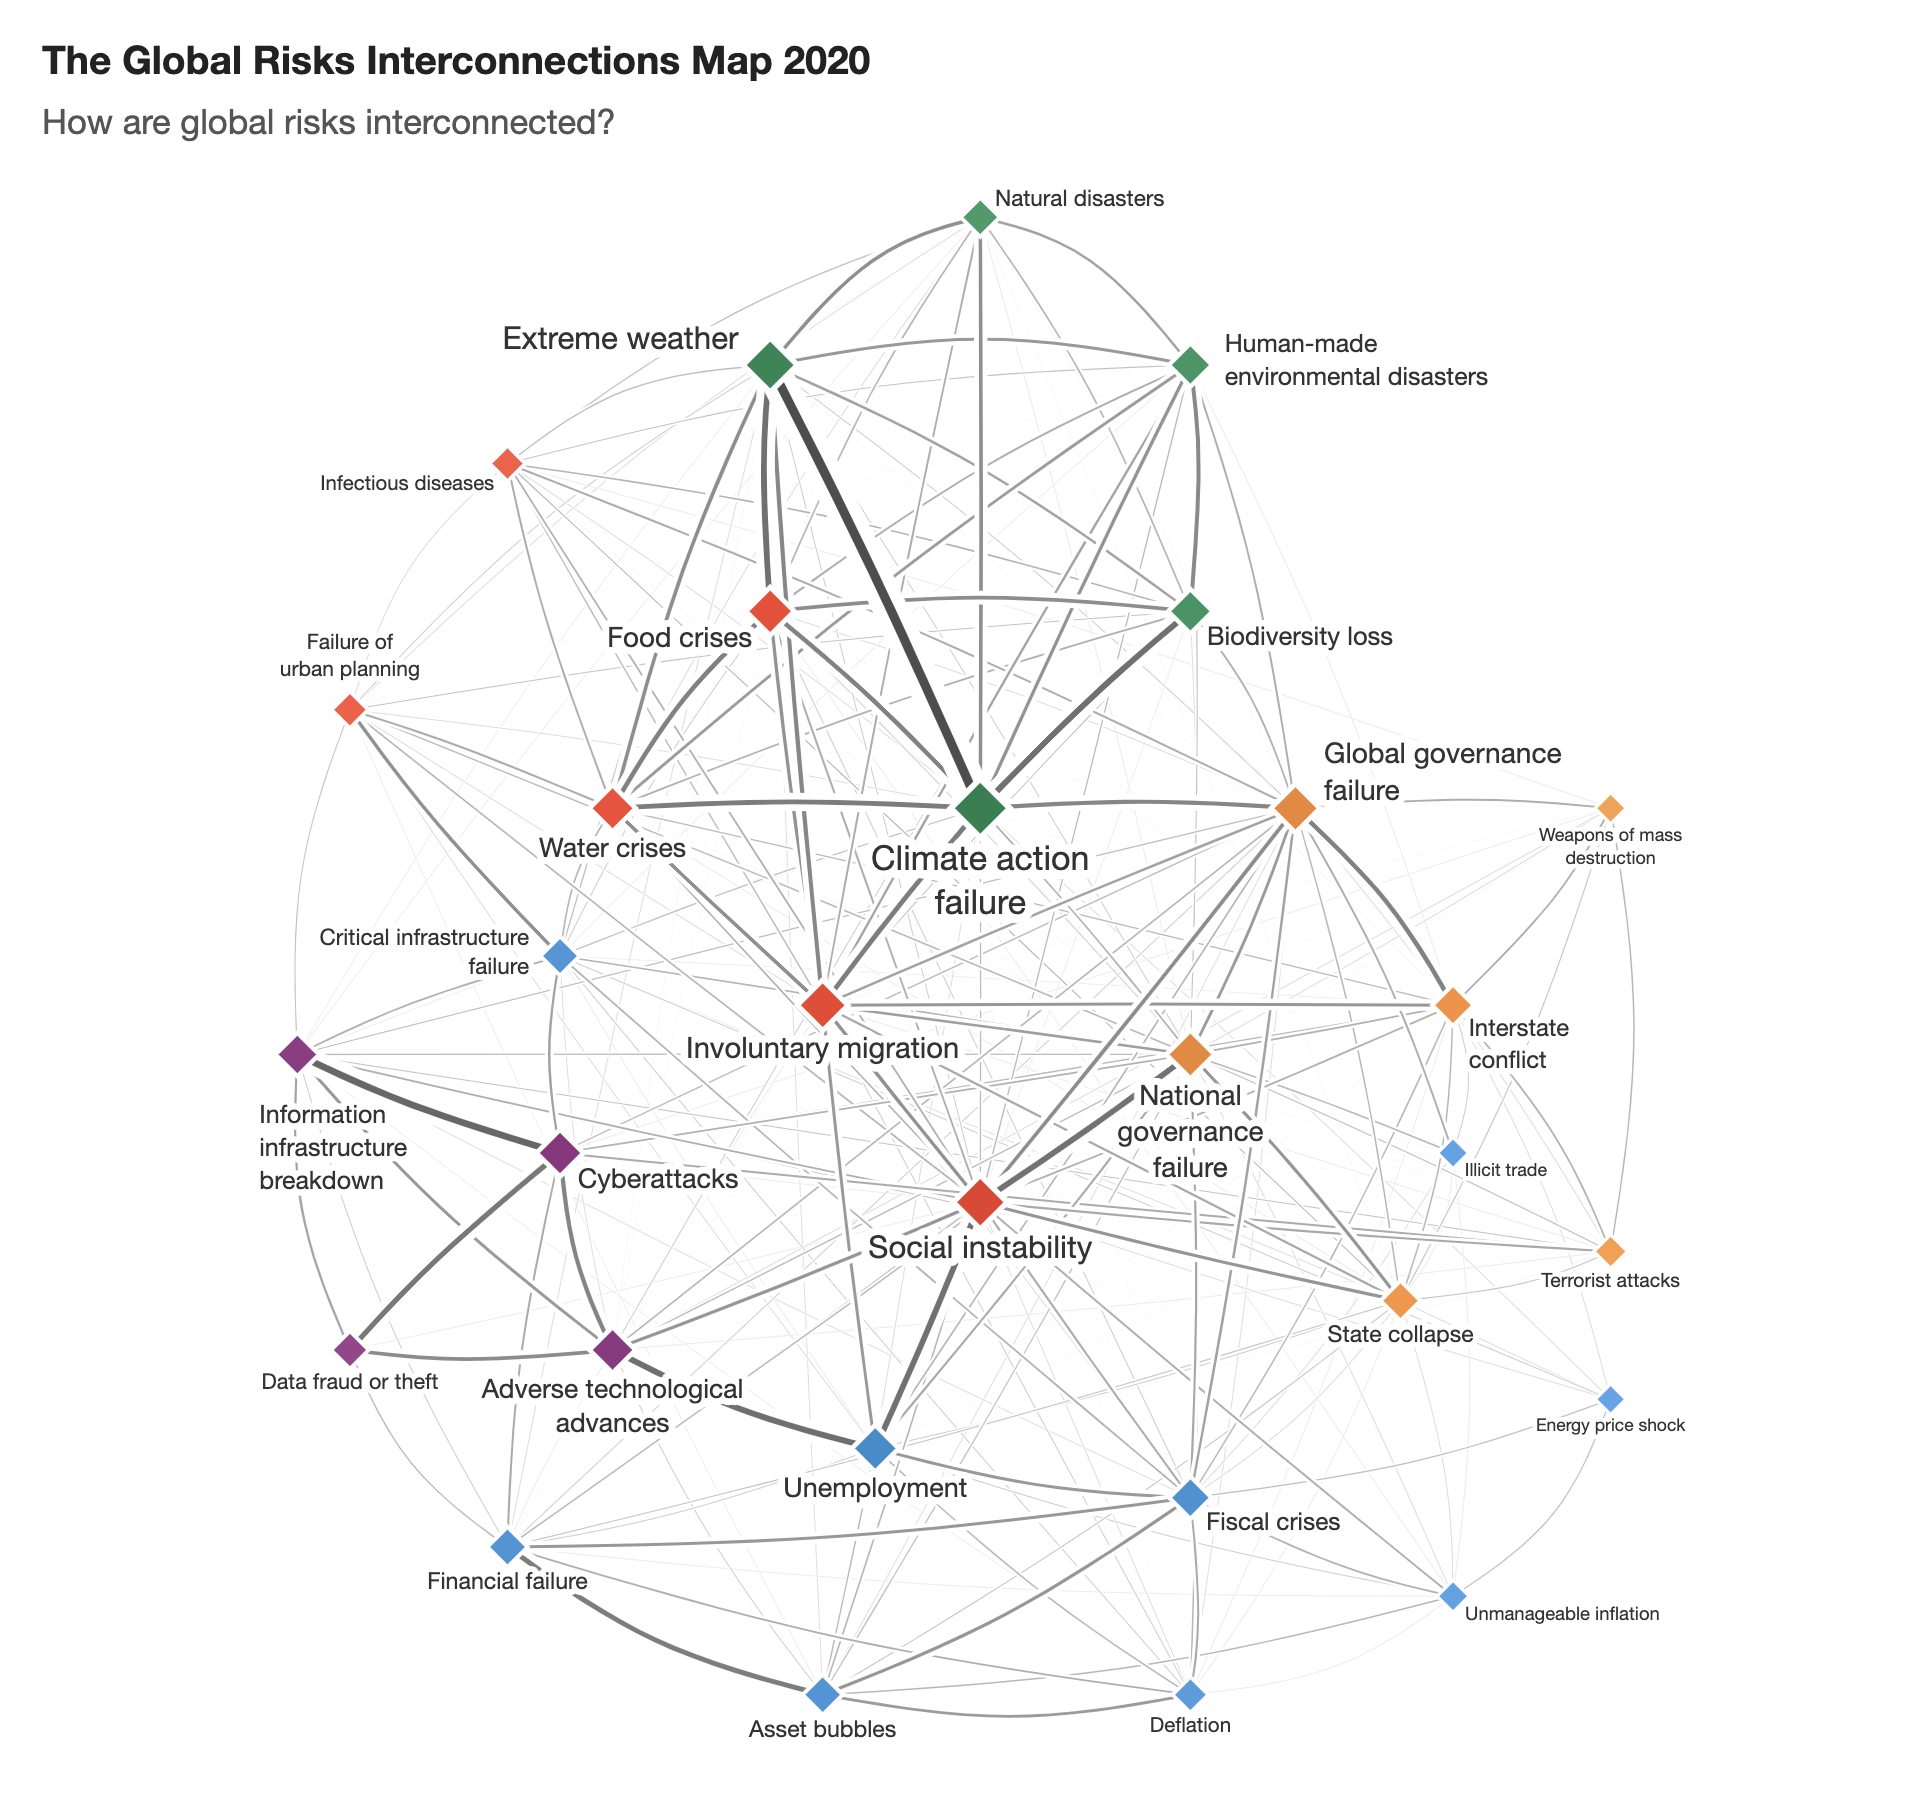
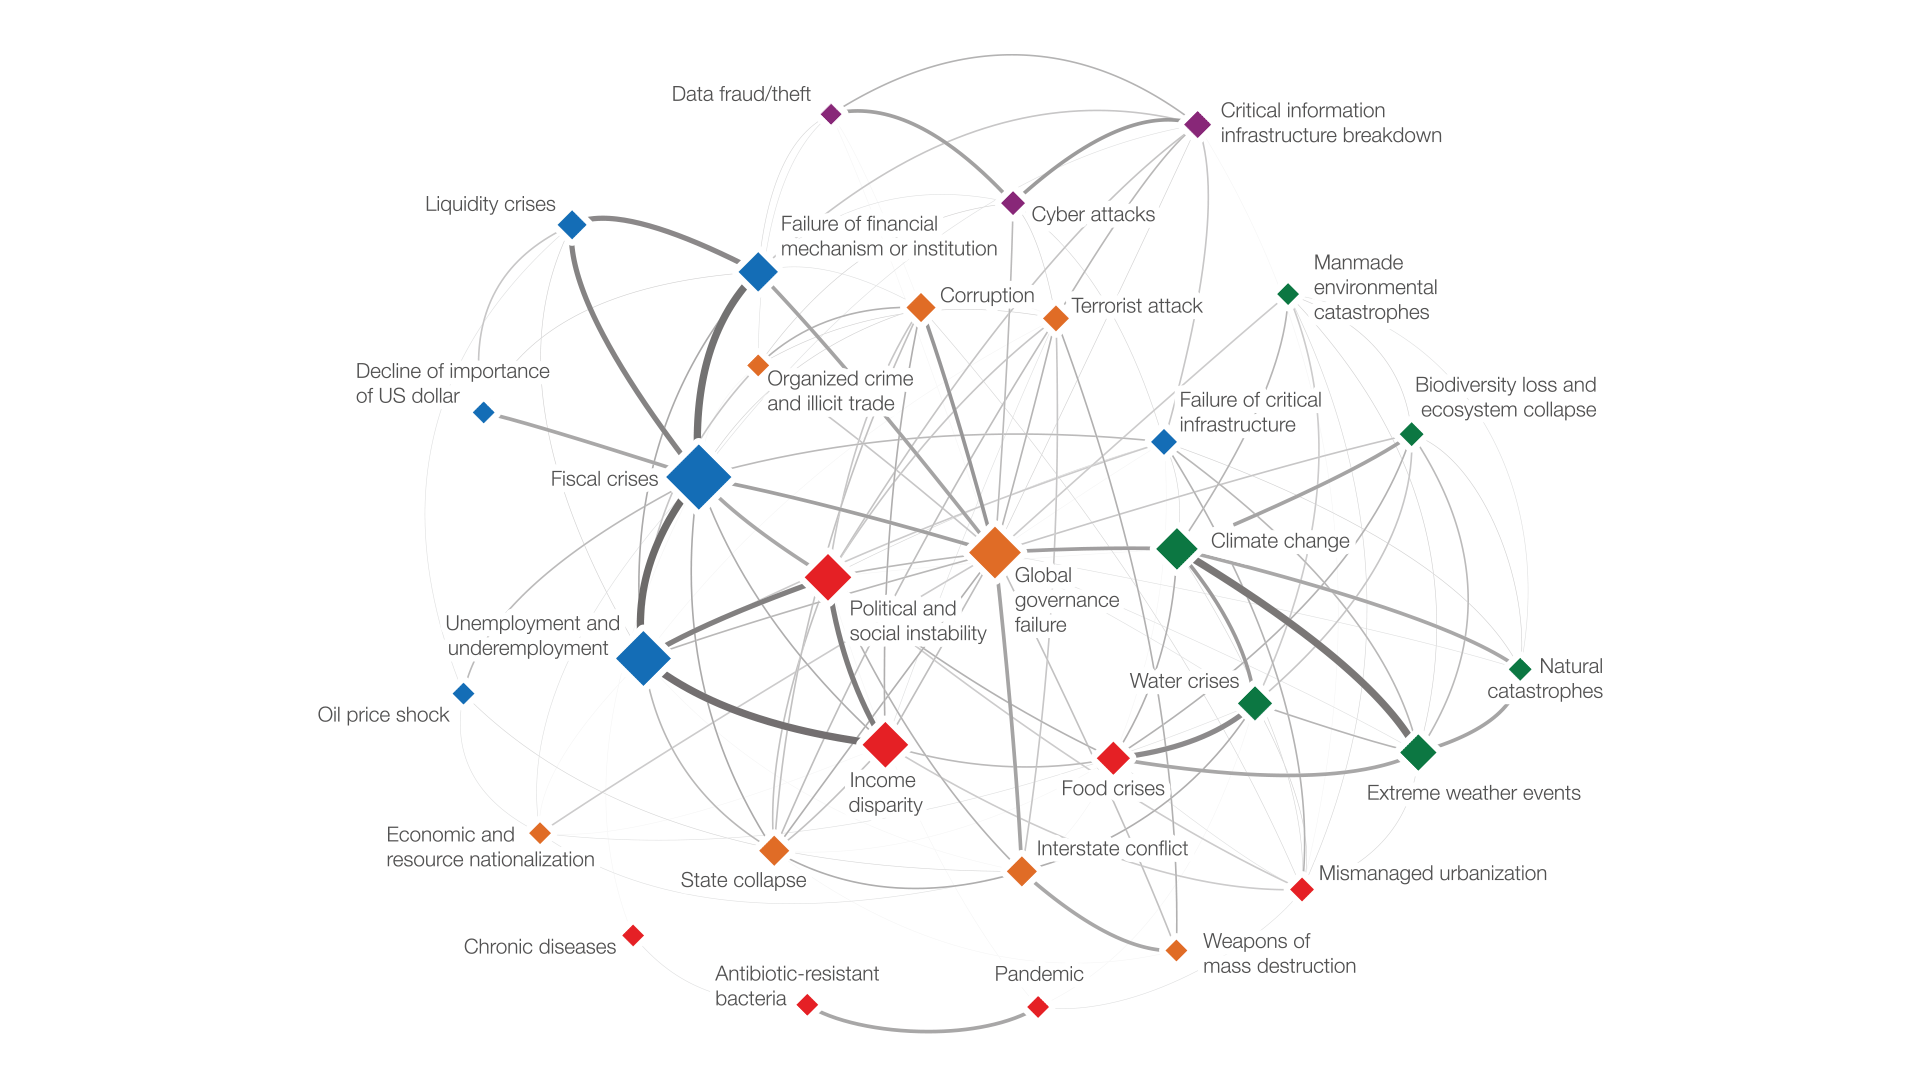
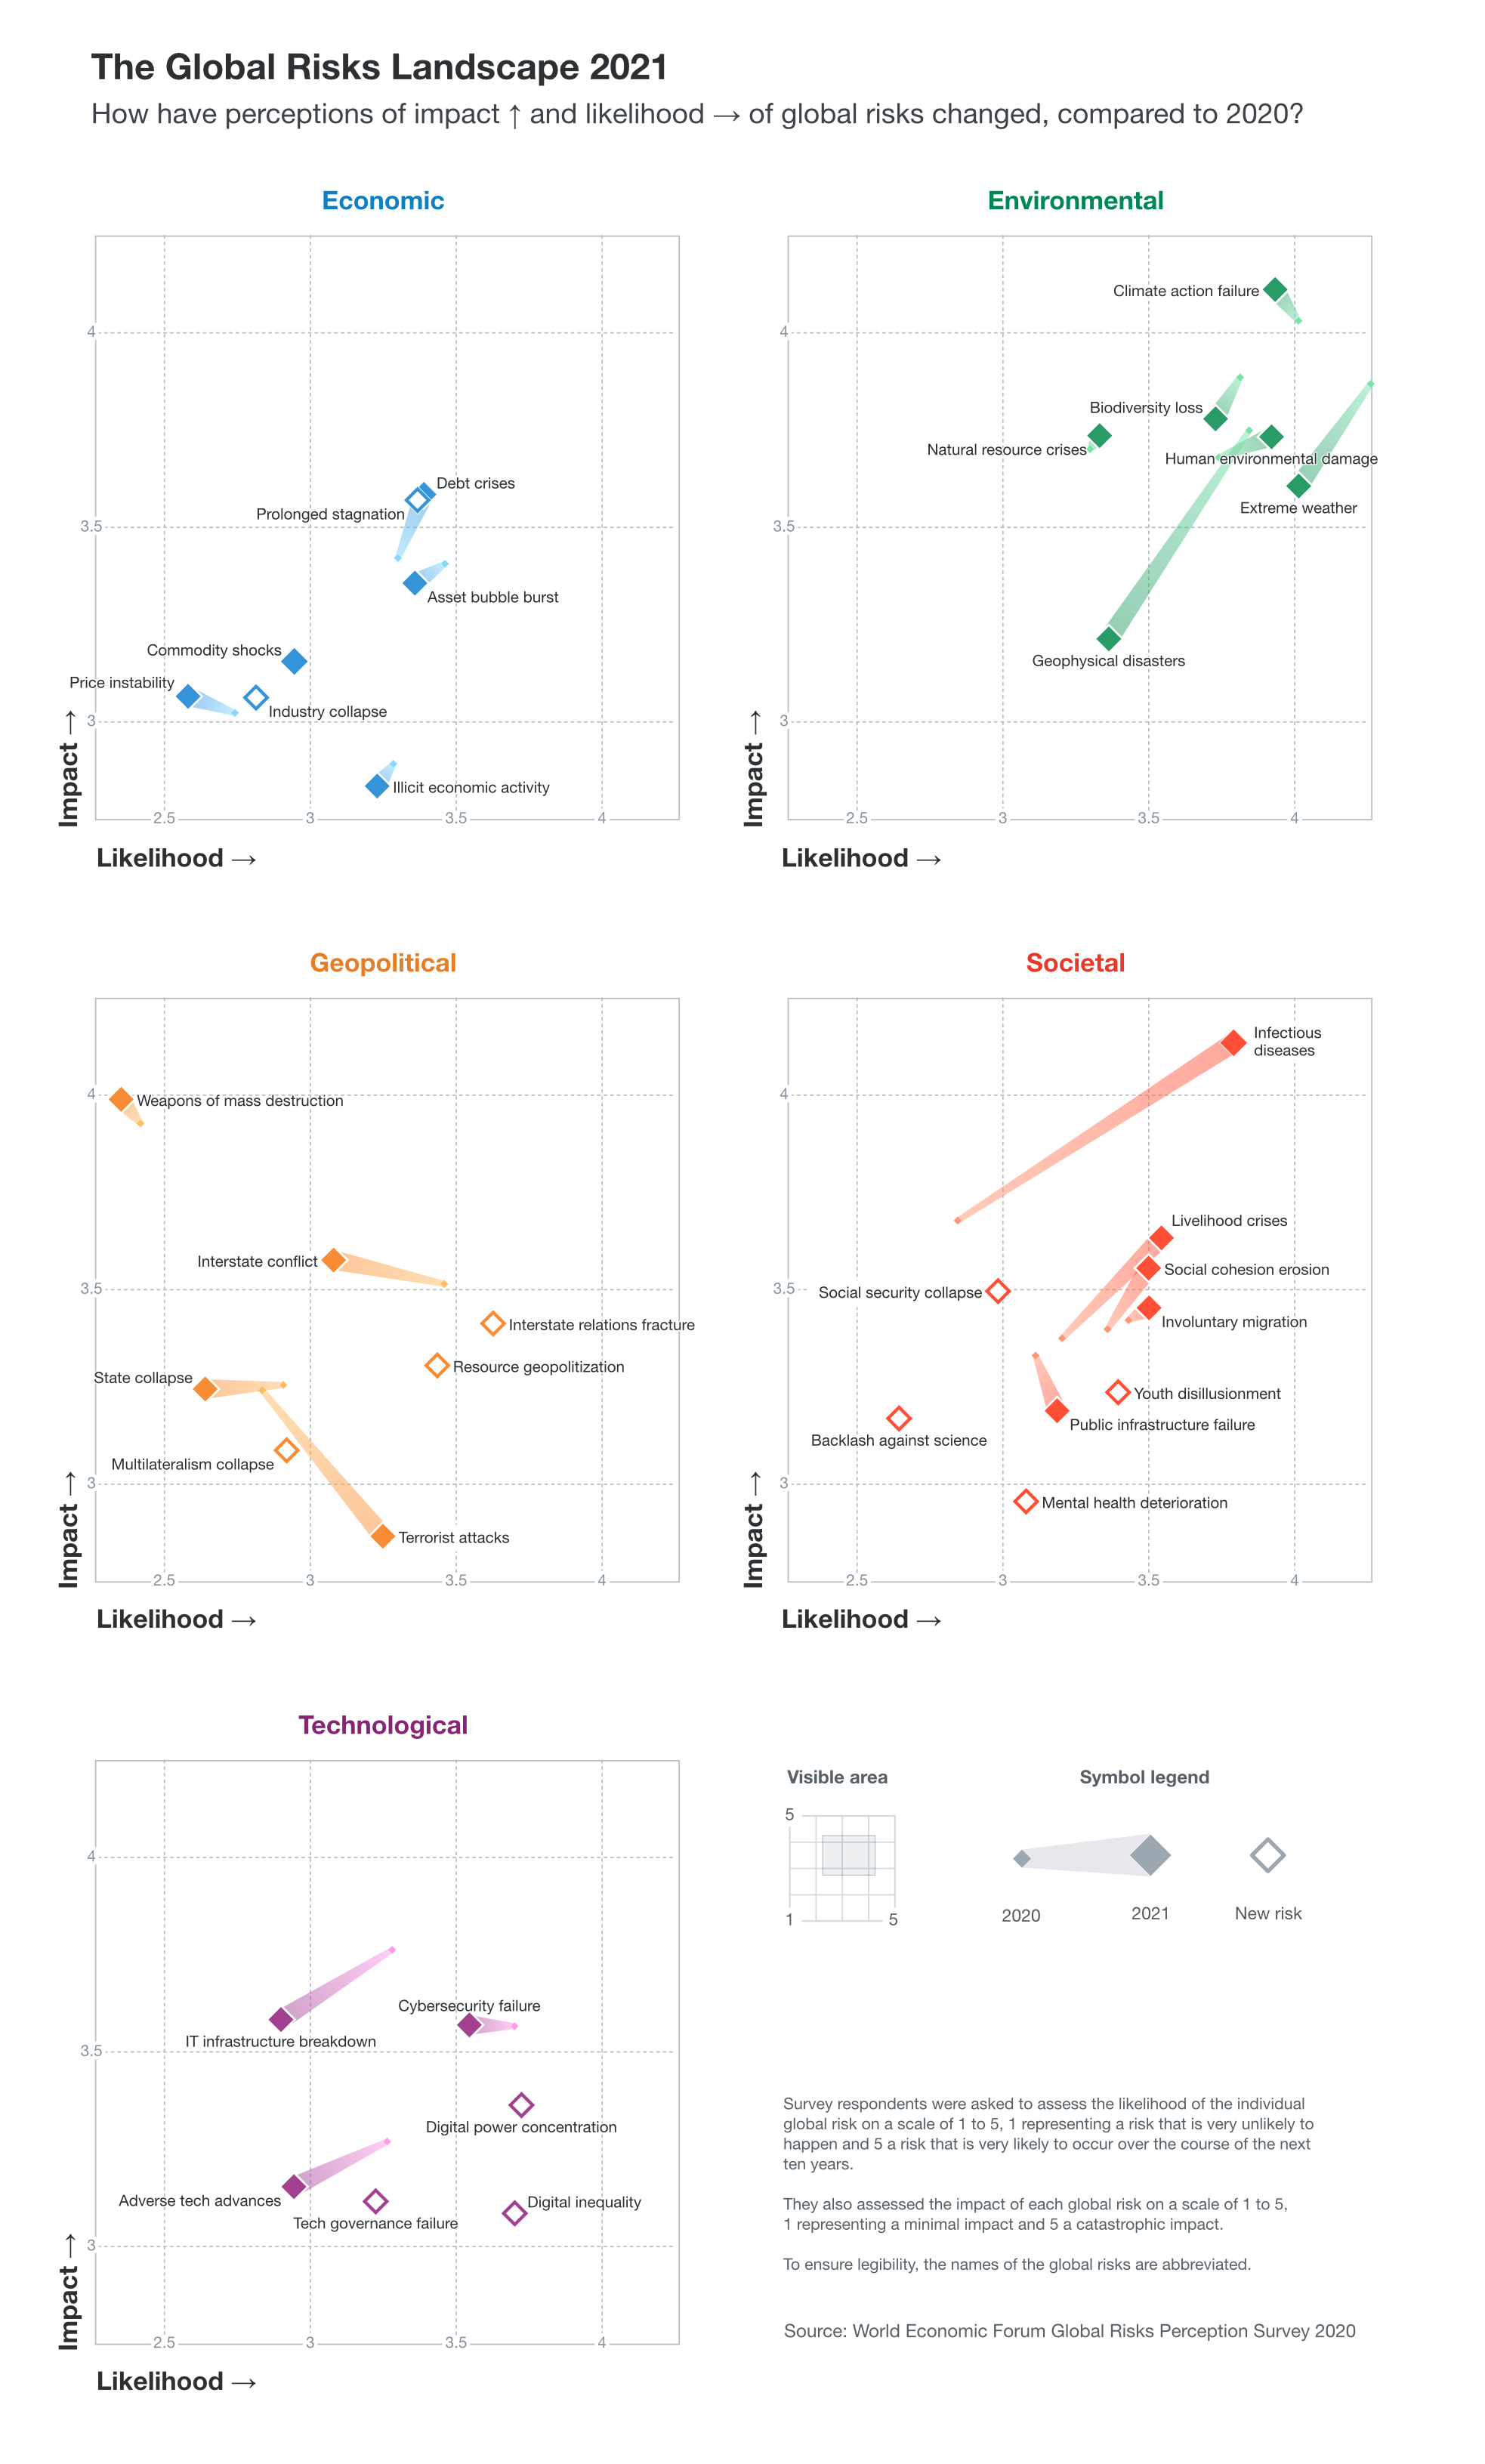
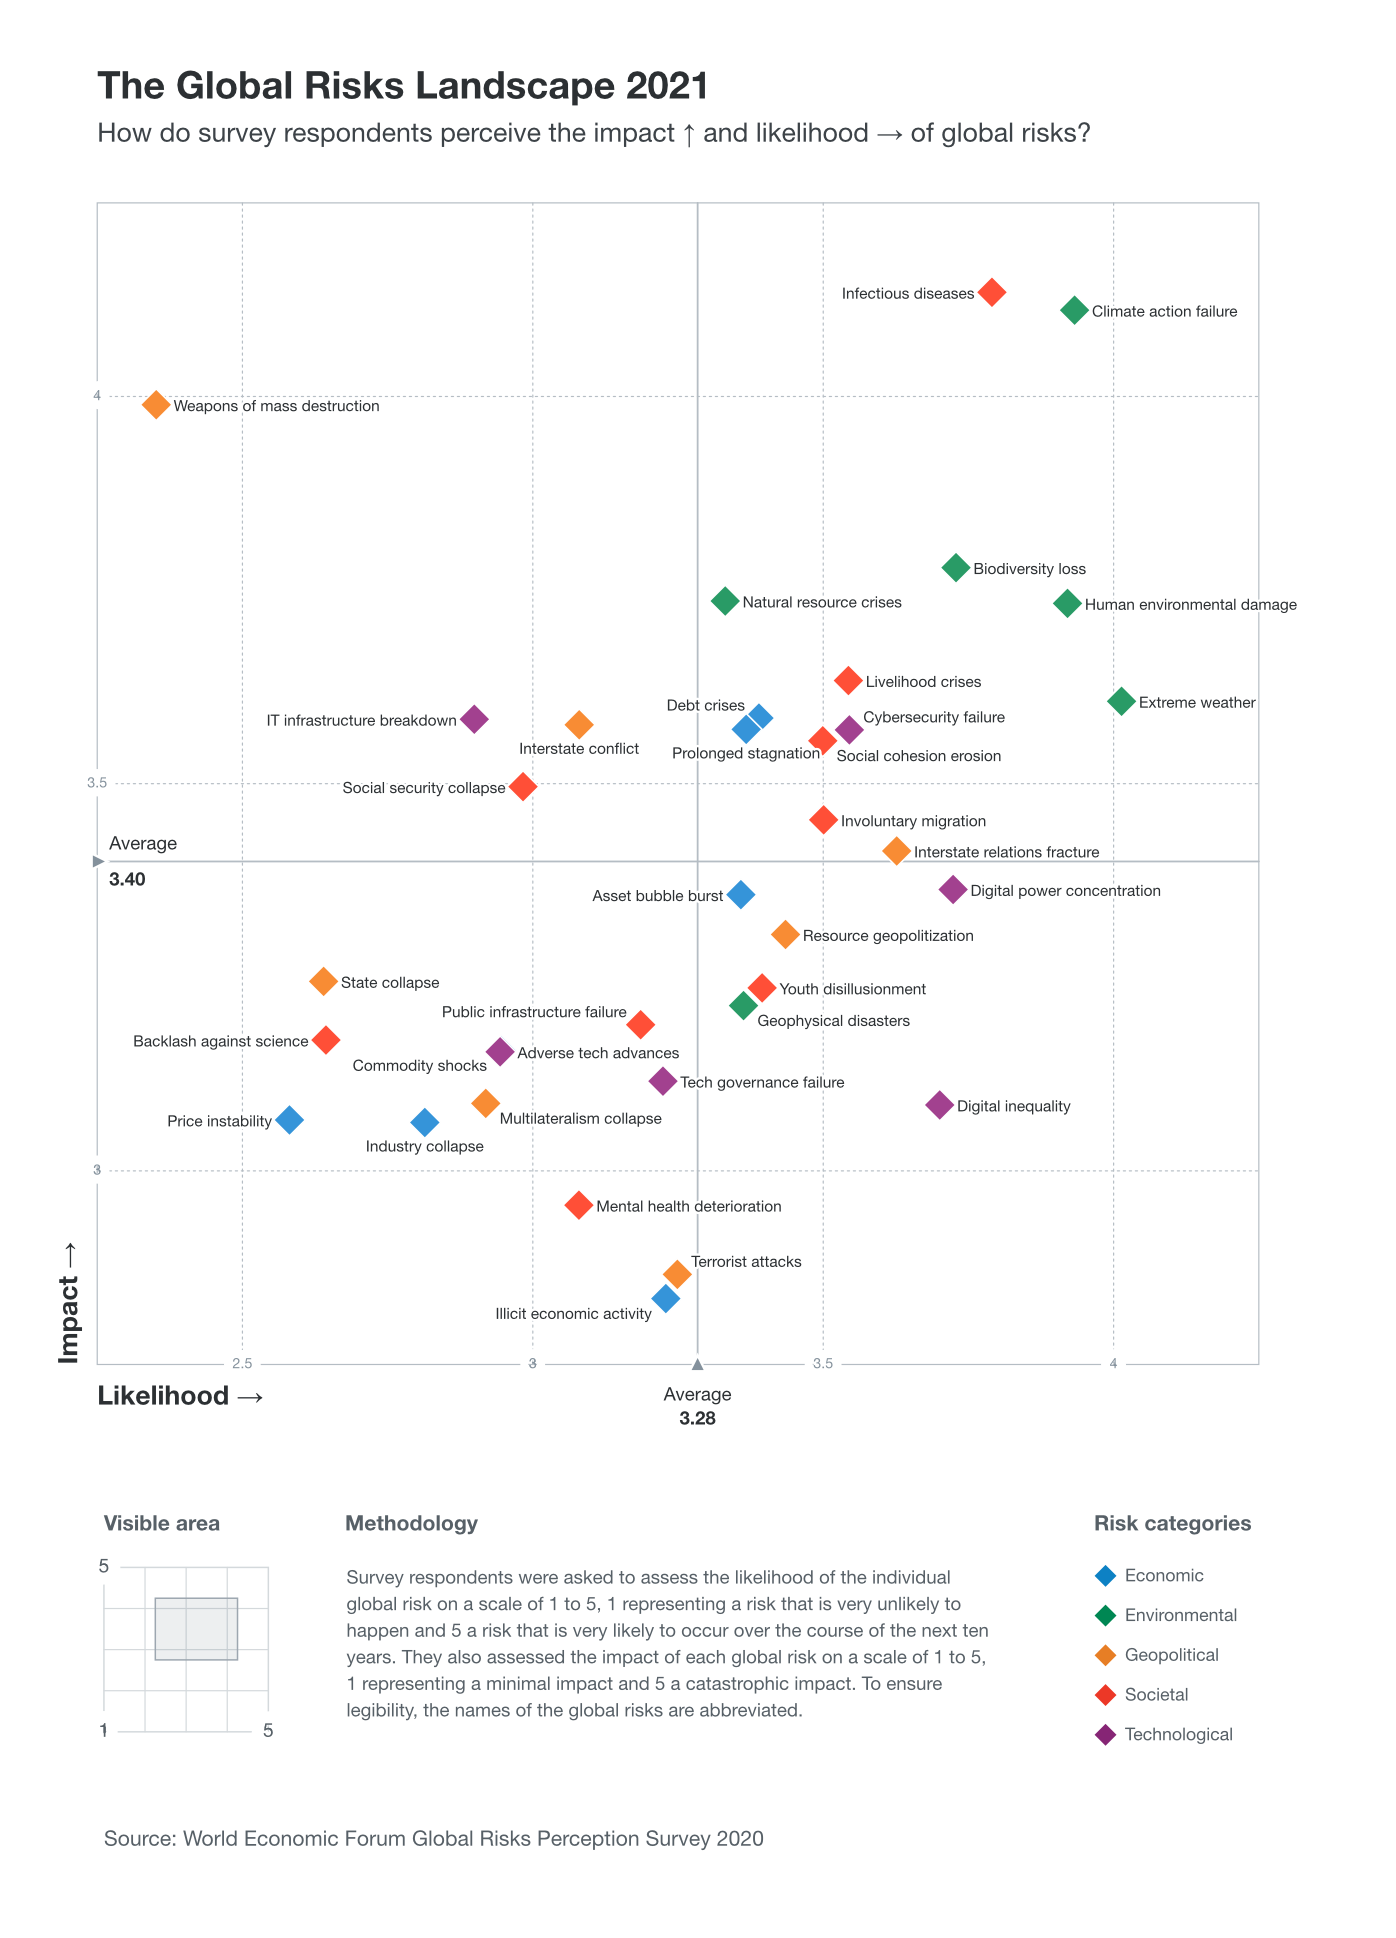
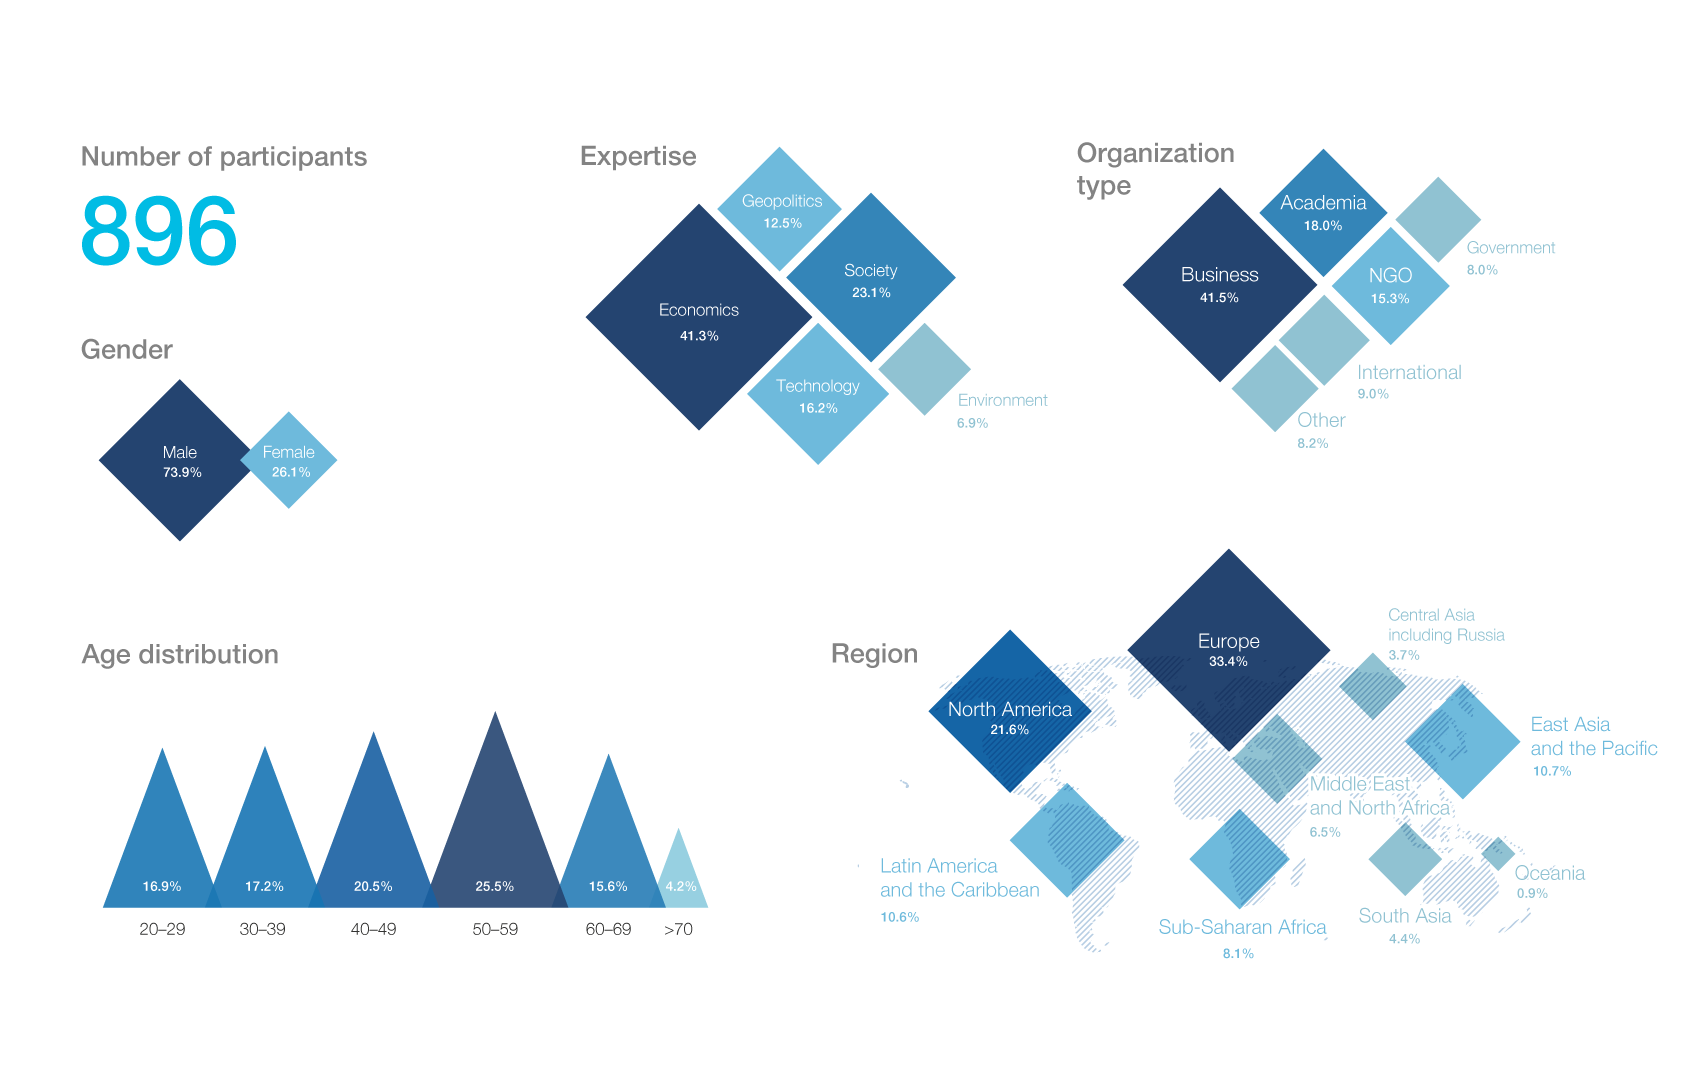
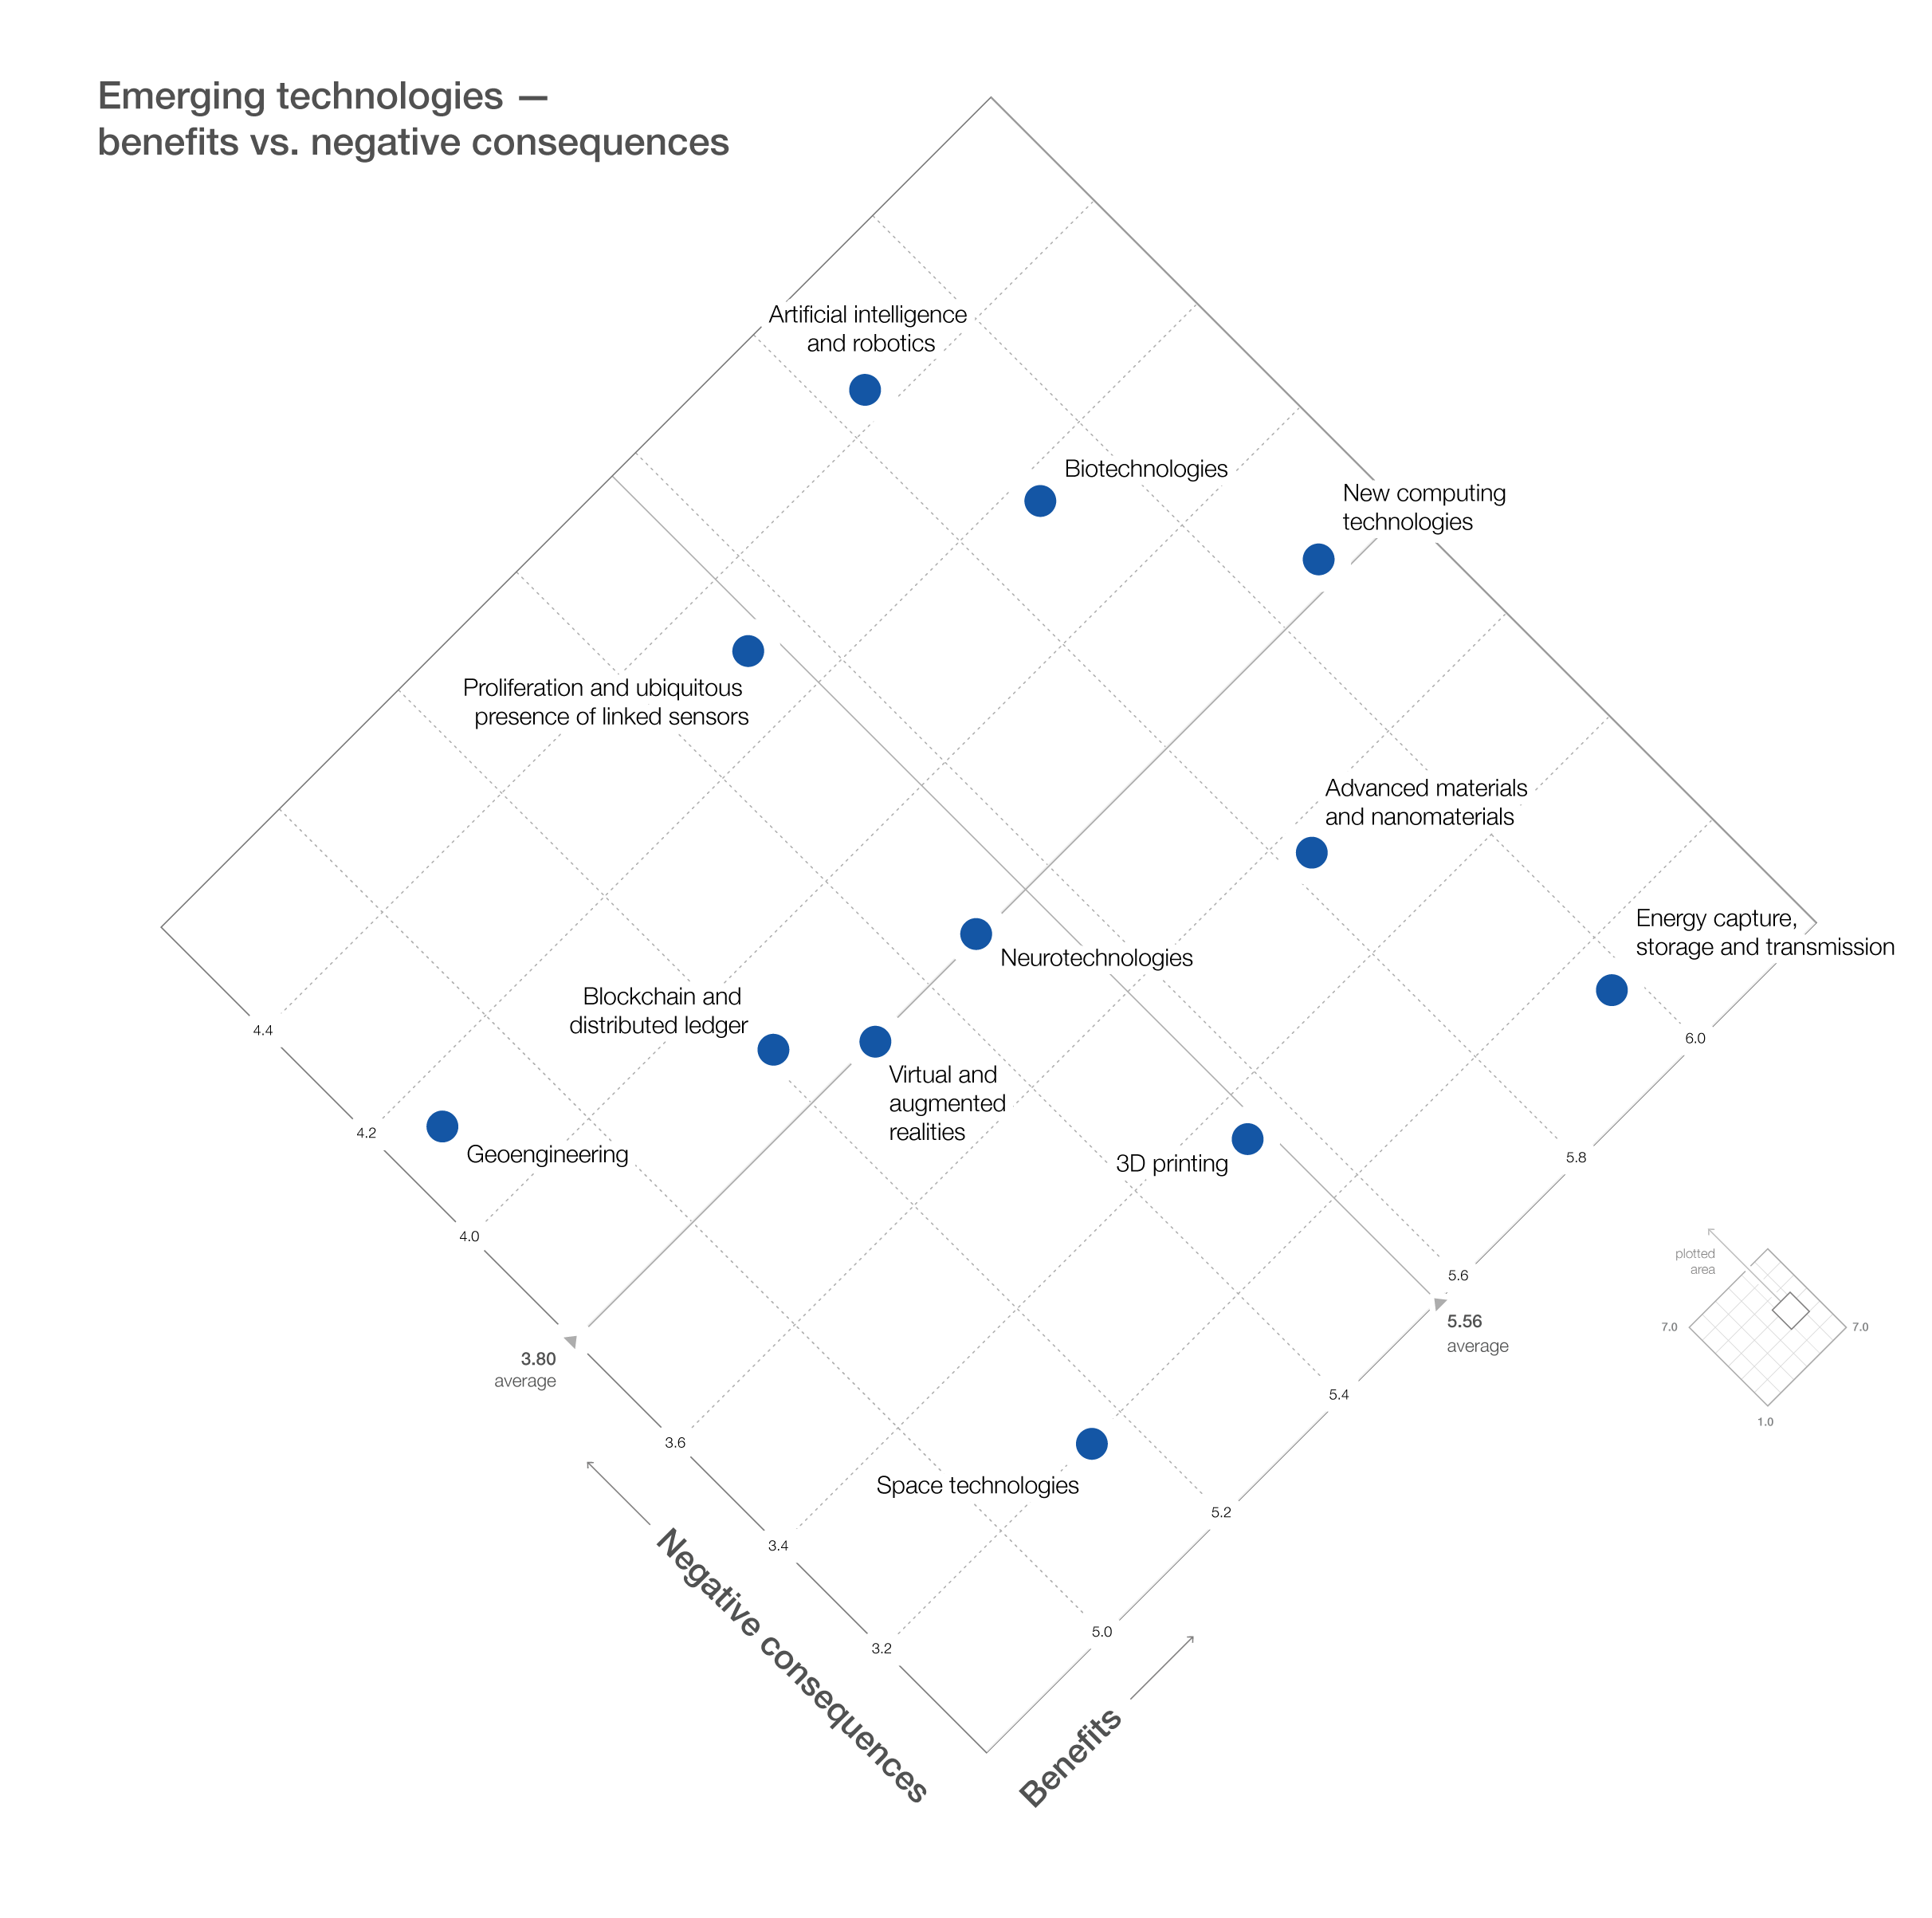
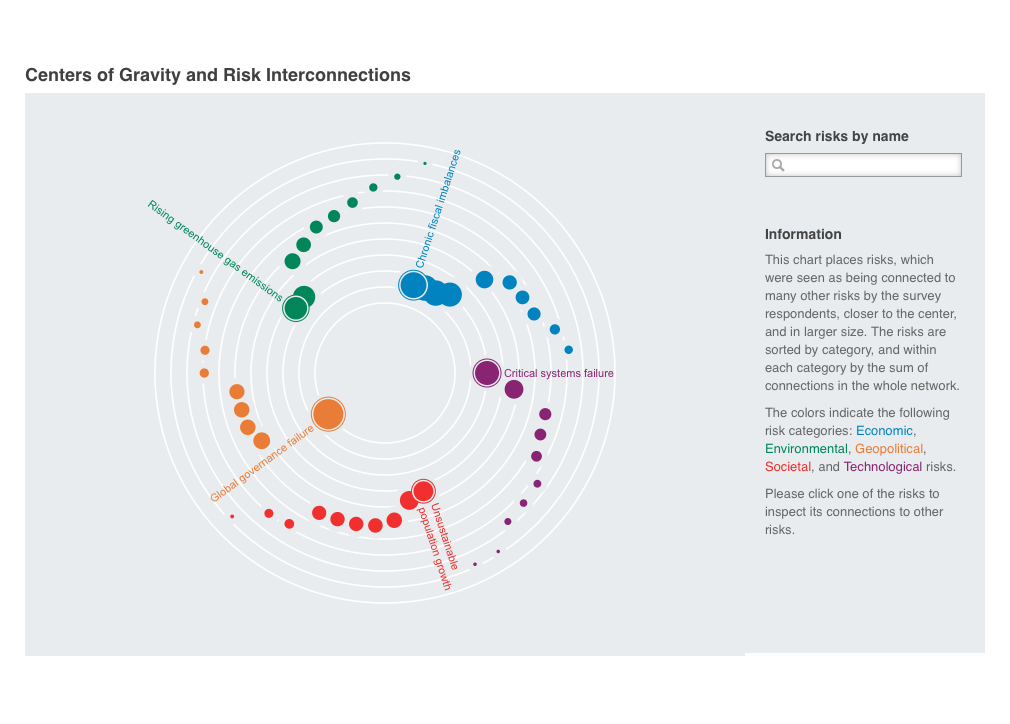
Each year, the world economic forum asks hundreds of experts about their perception of future important risks. The Risk Interconnection Map visualizes the topology resulting from the experts' responses how these risks relate to and influence each other. For calculating the maps, I use a custom-made physical simulation to have full layout control.
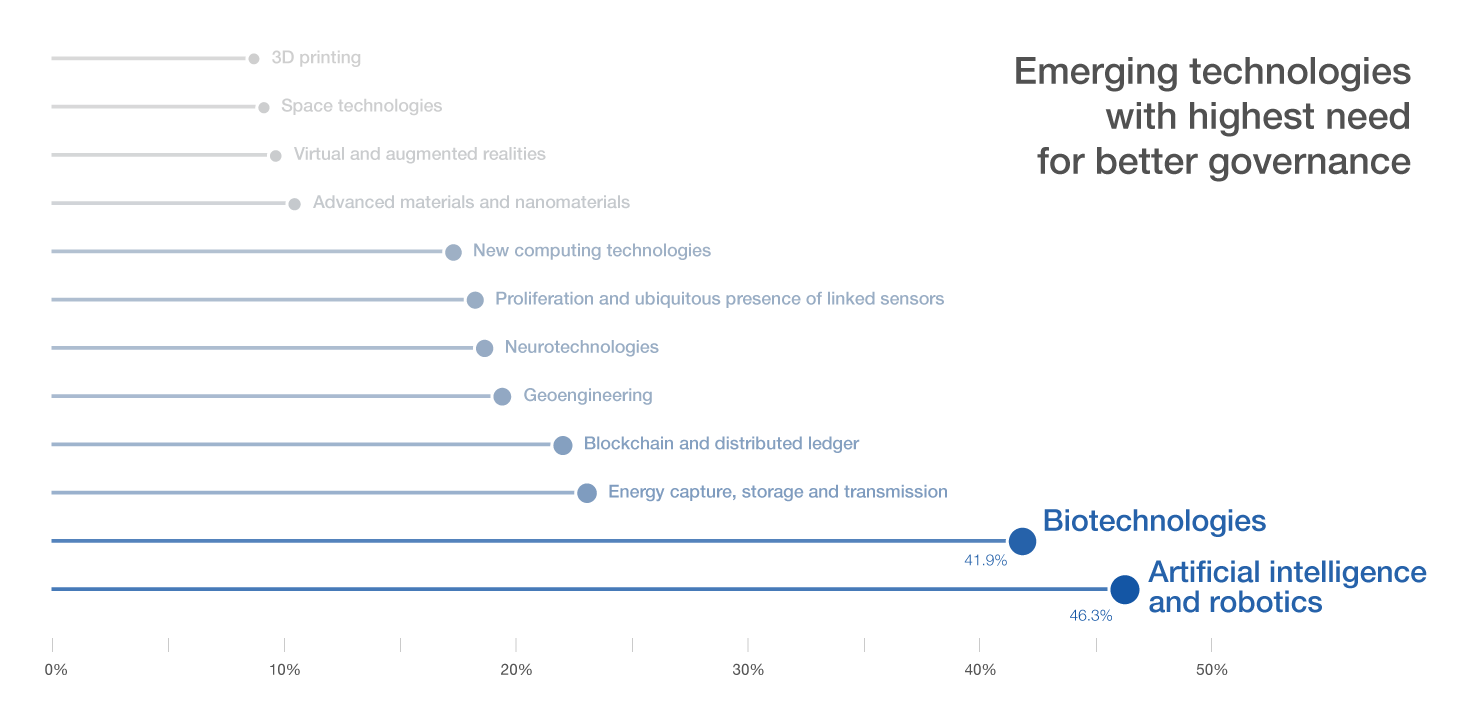
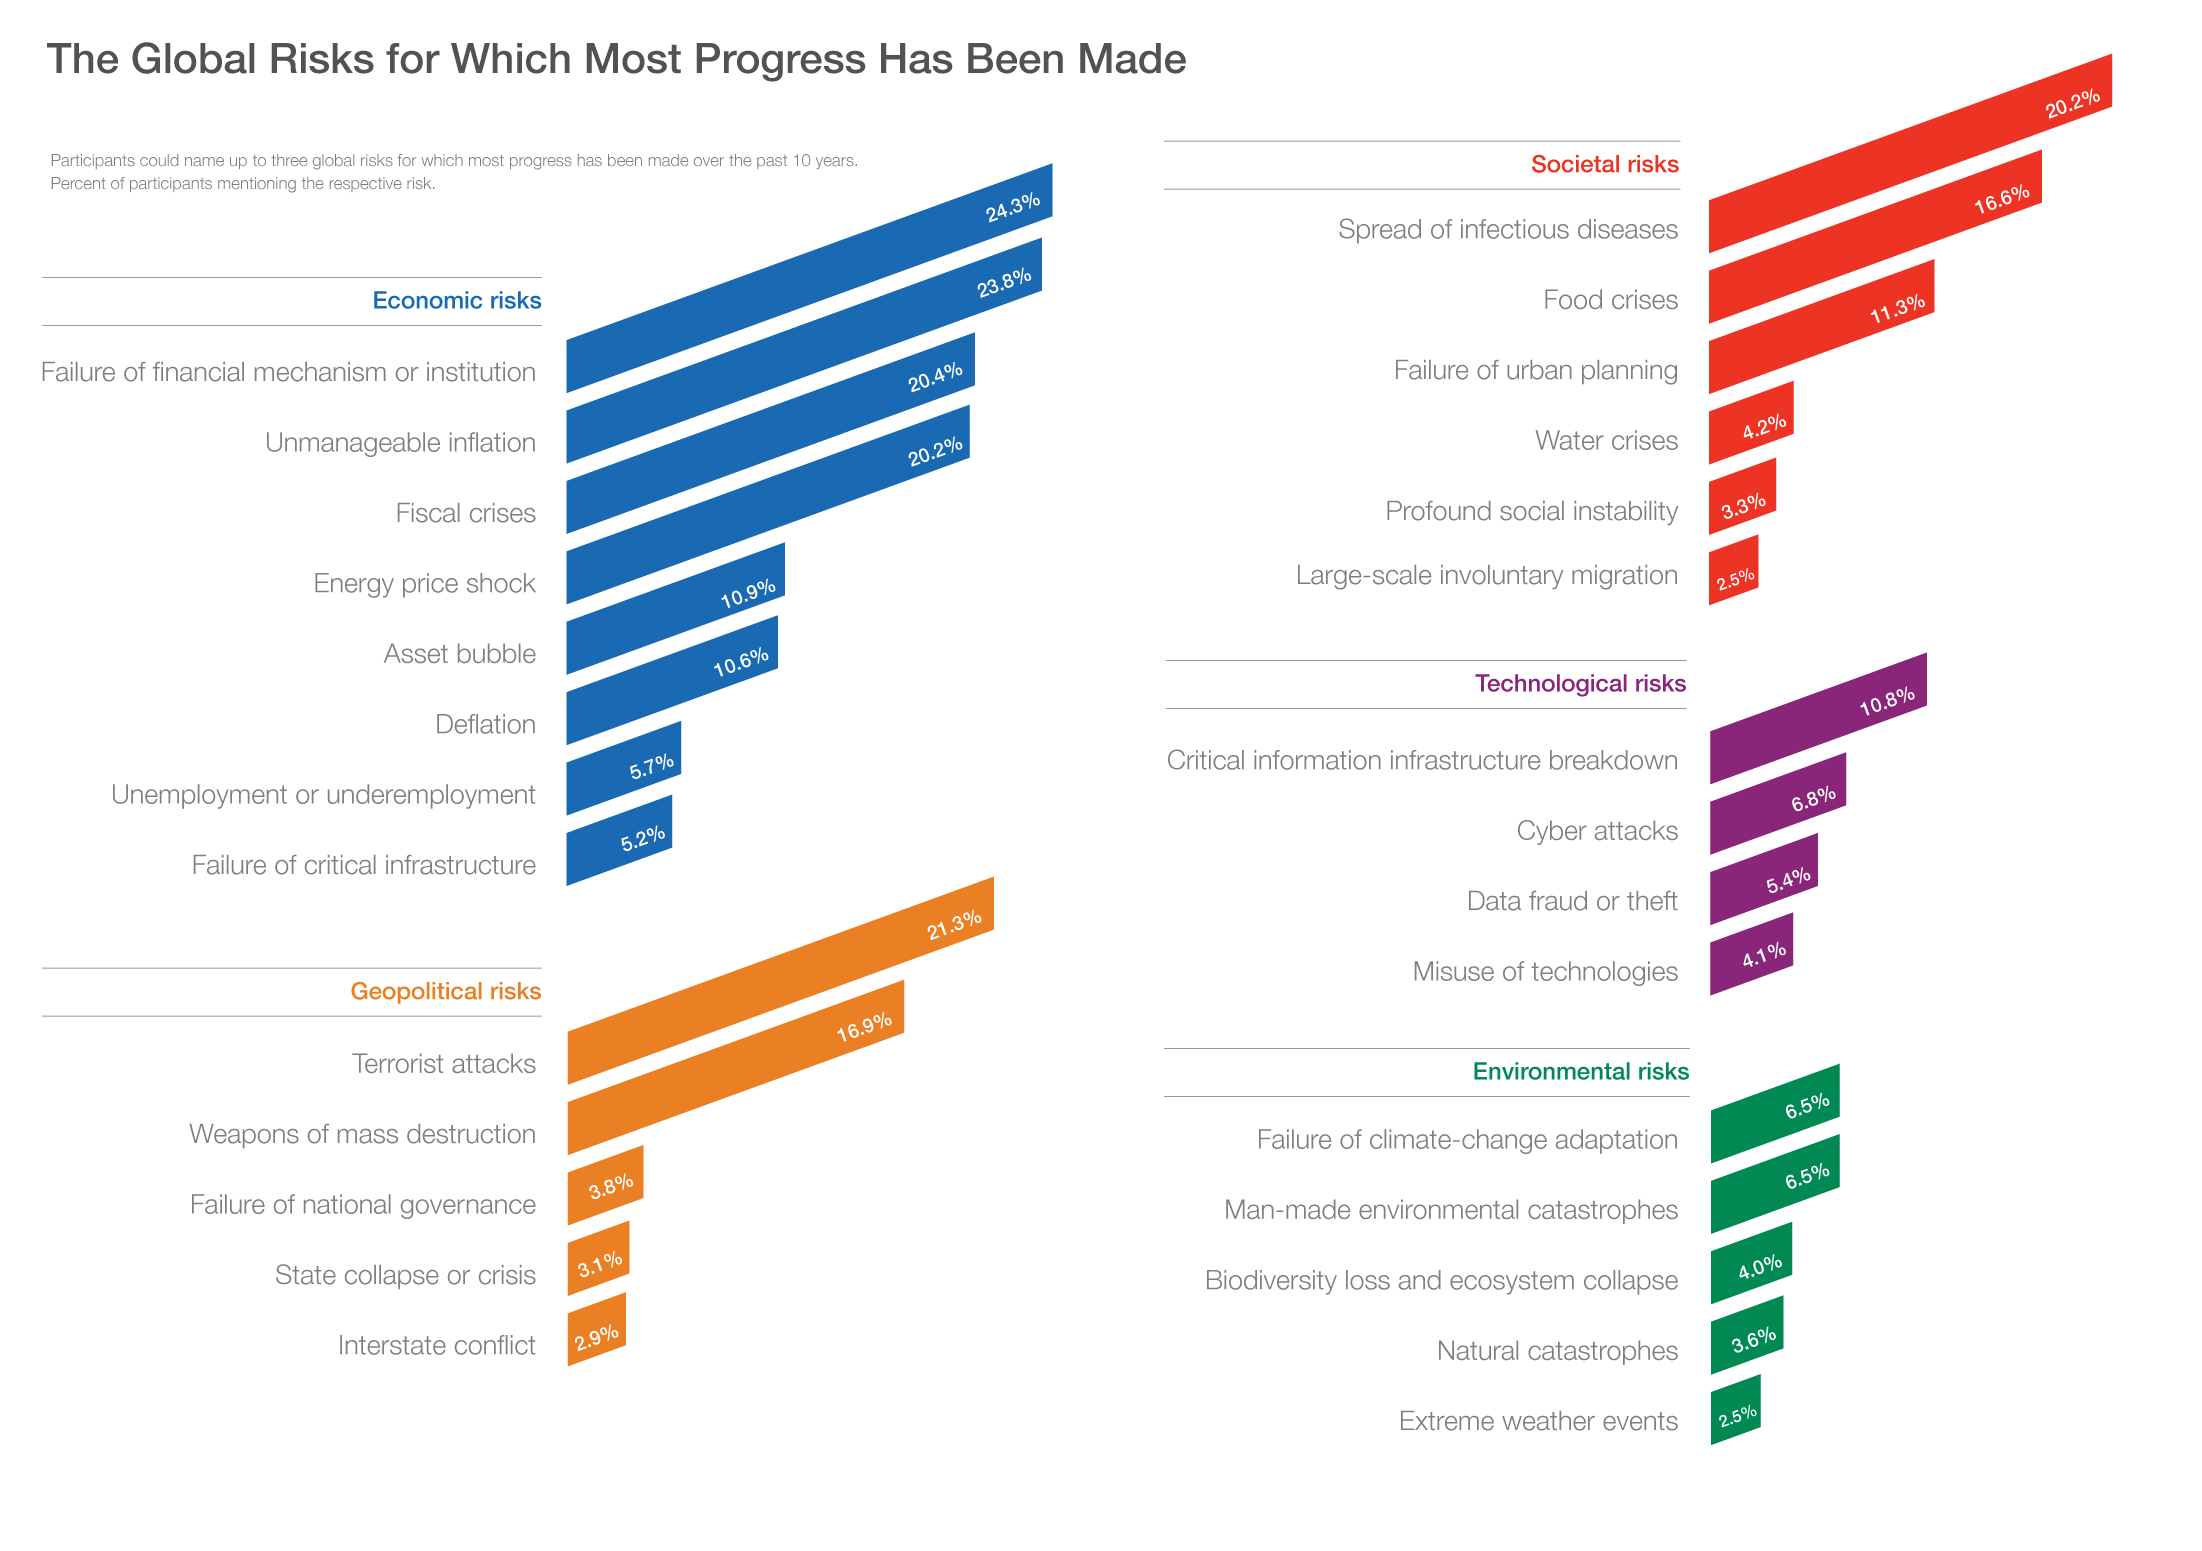
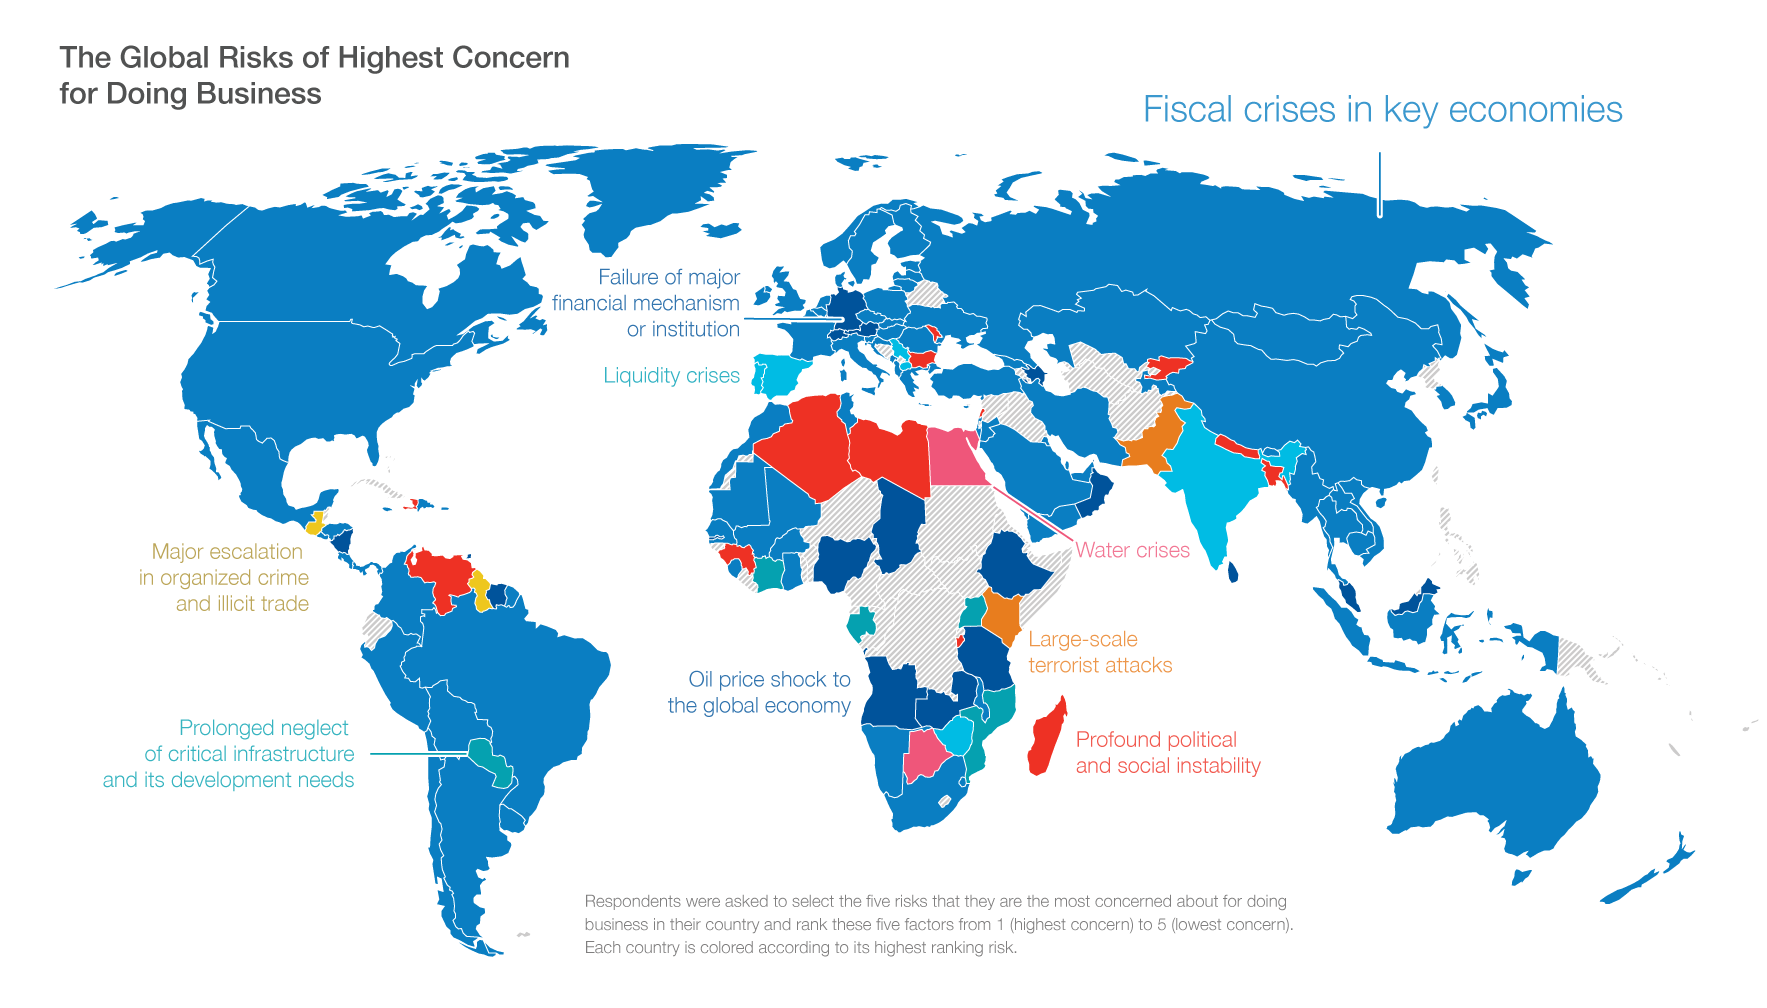
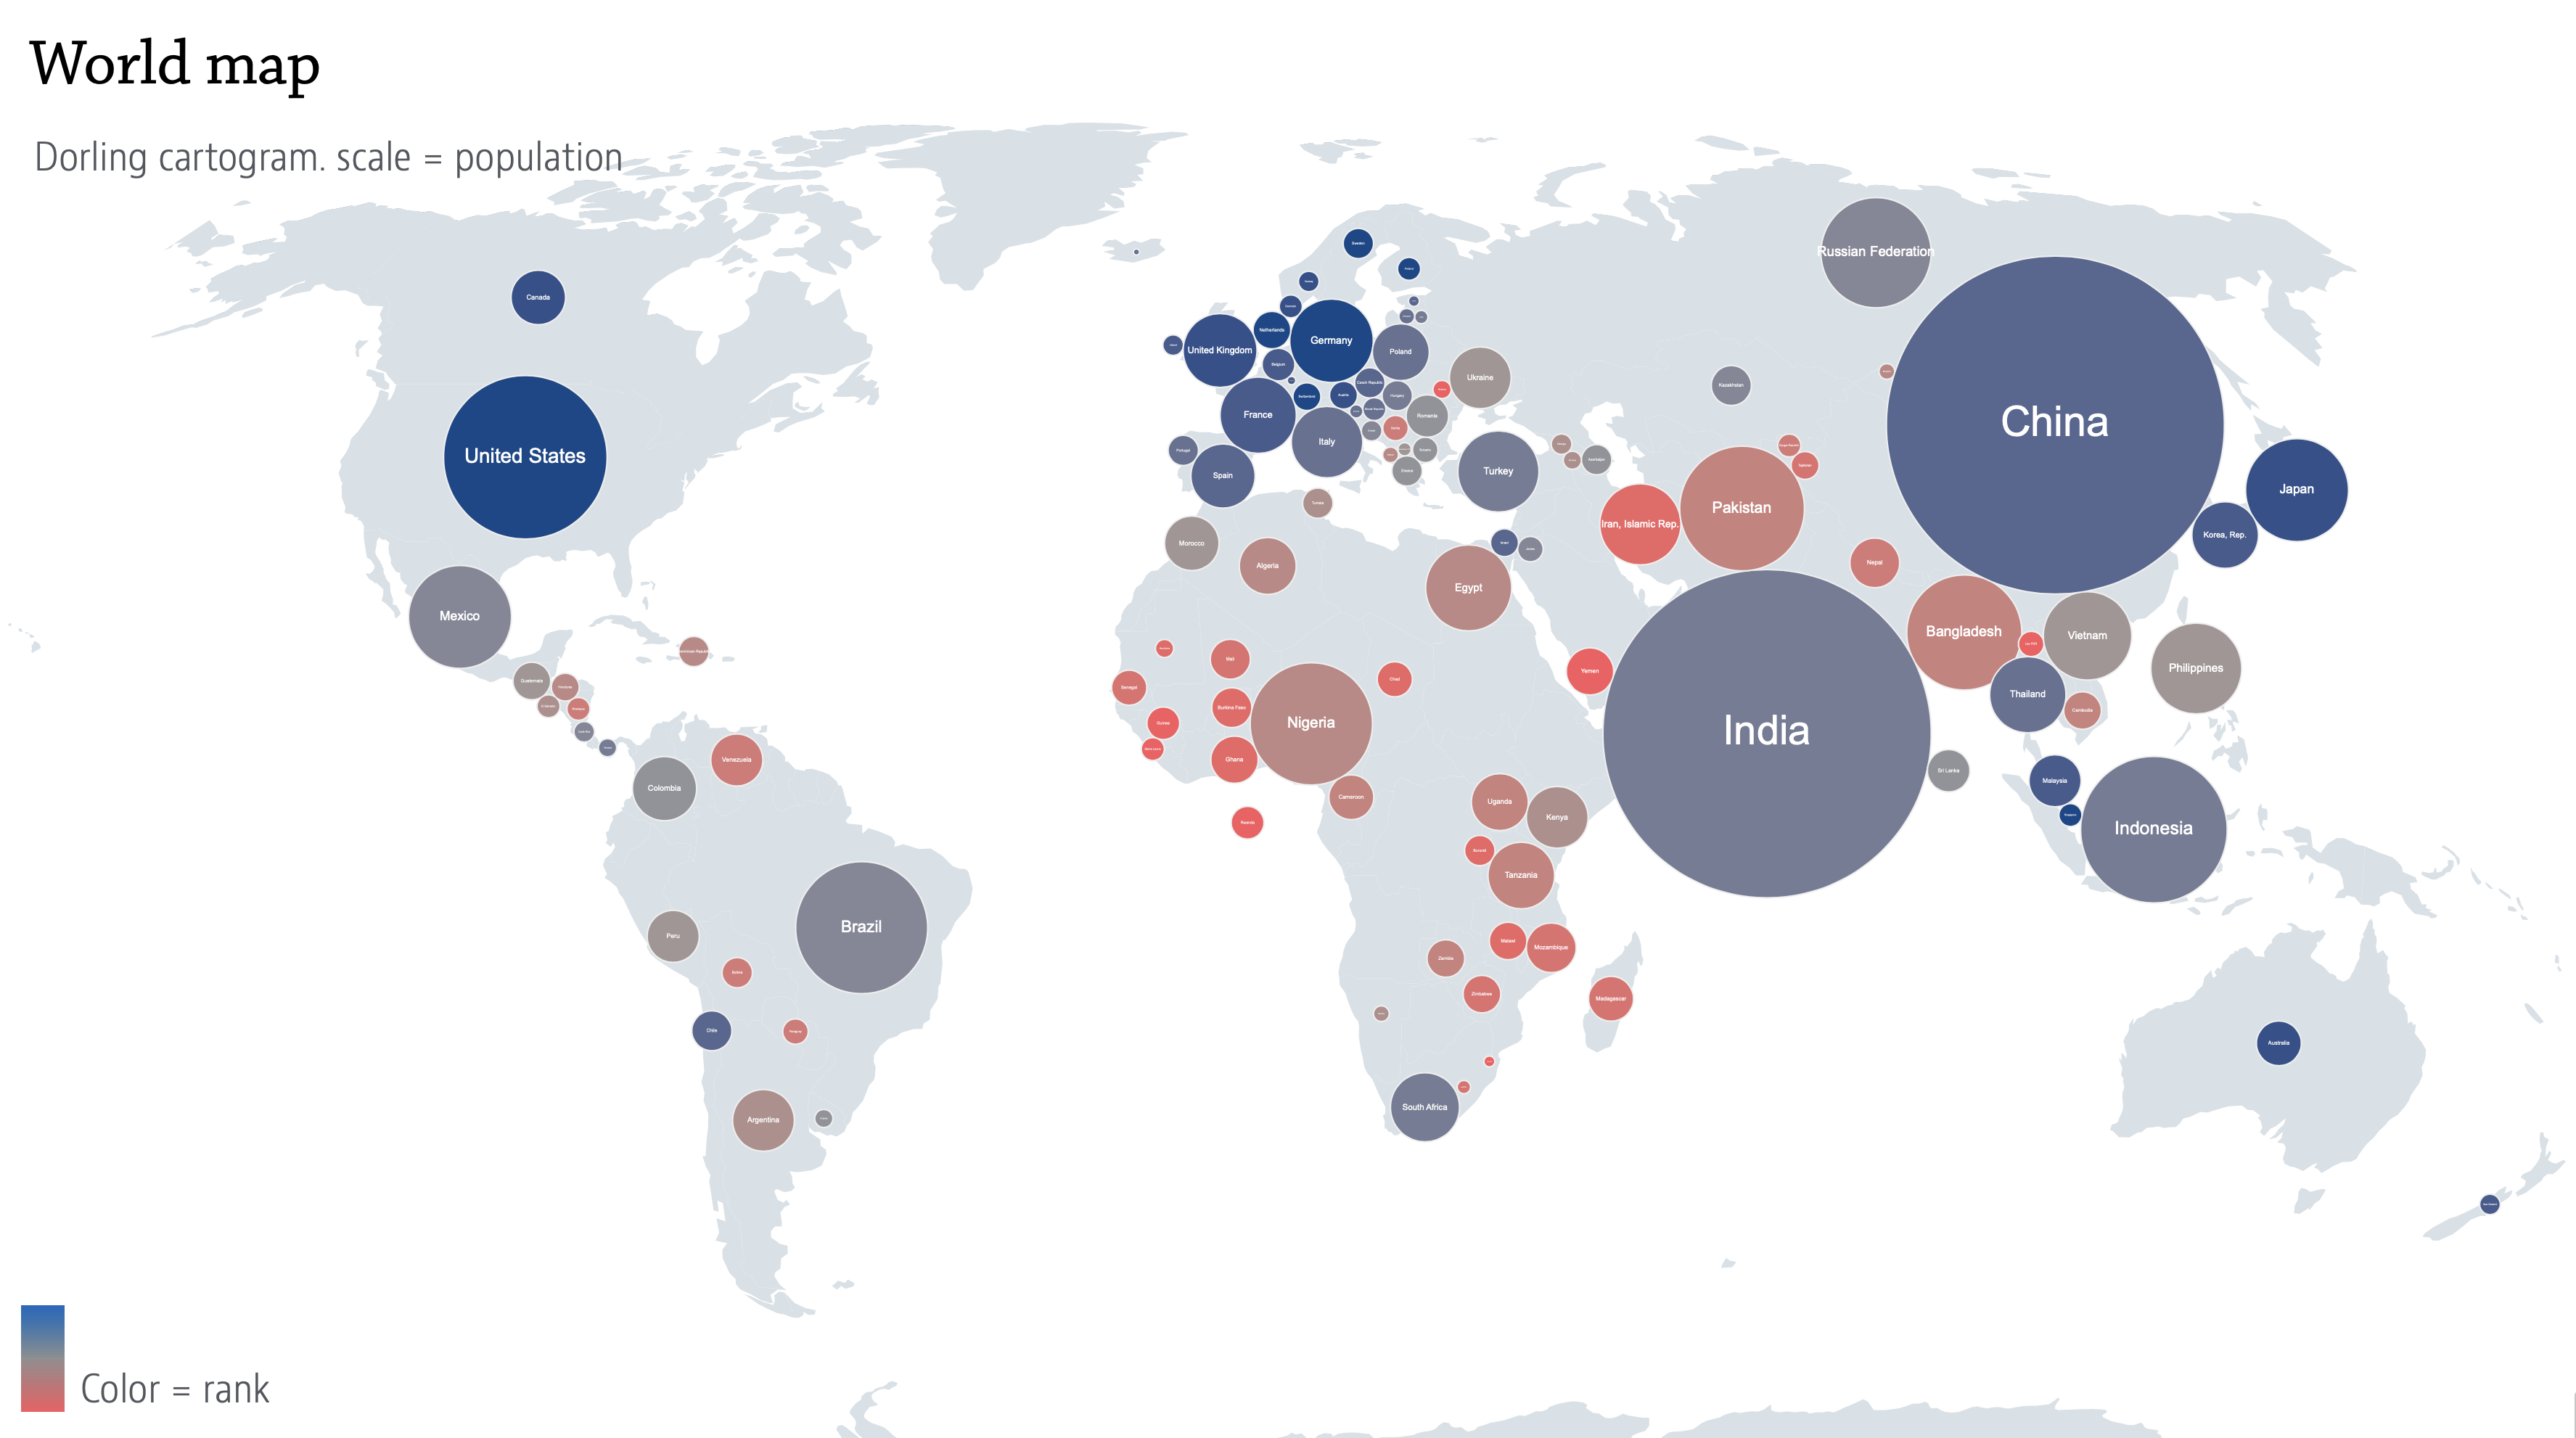
Some of the static graphics from various reports over the last ten years:


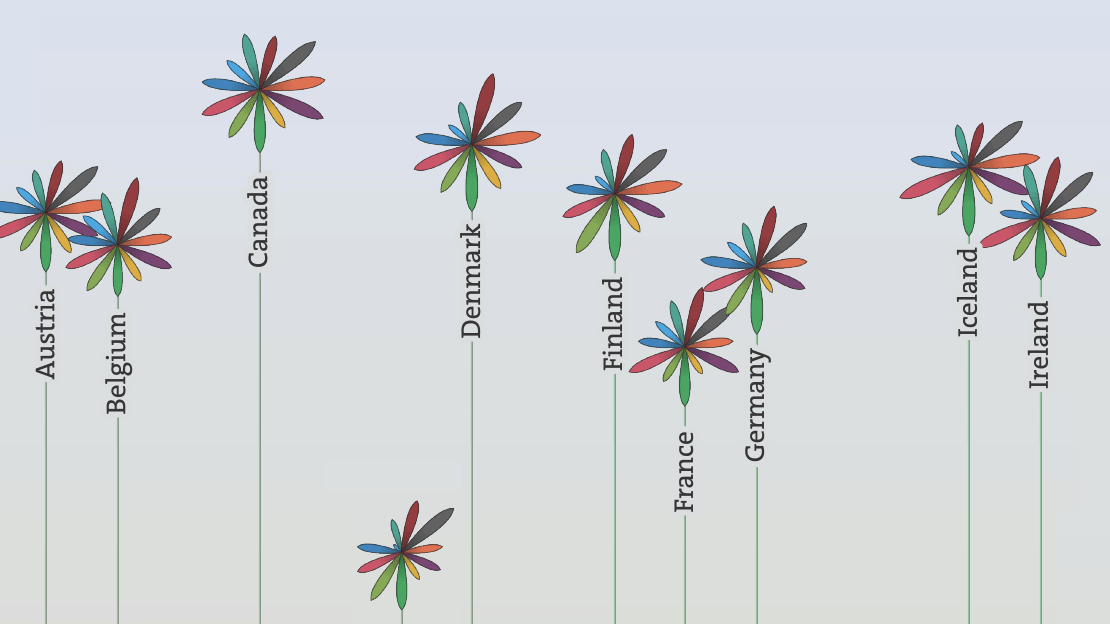
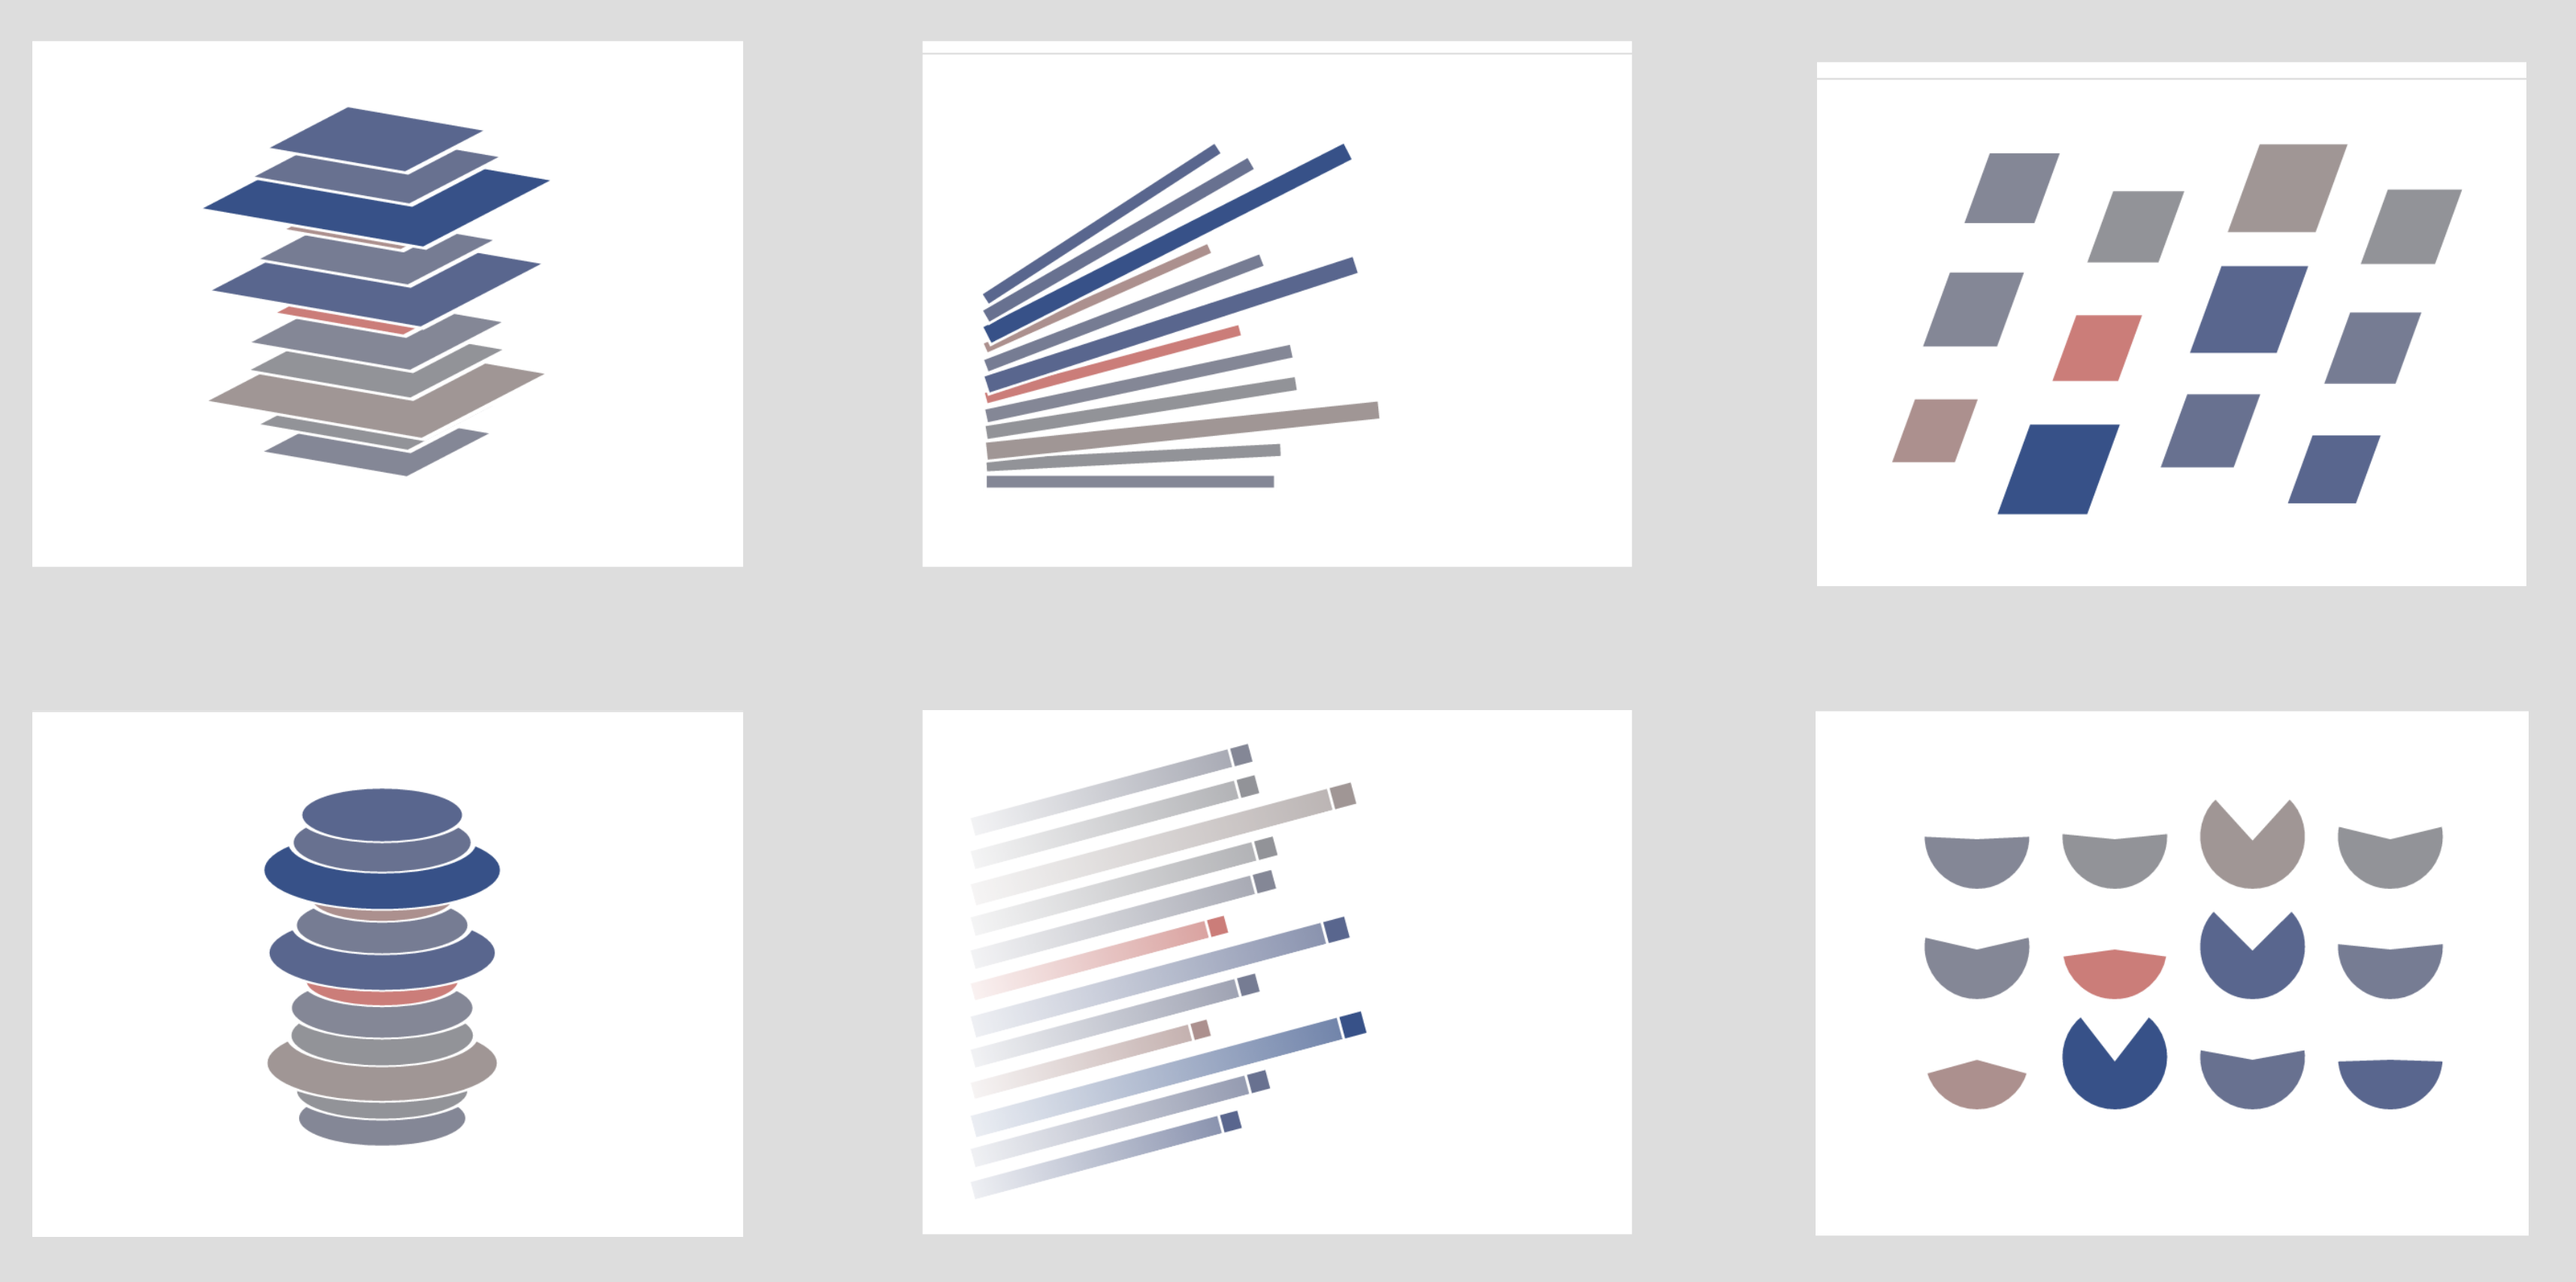
Explorations
Unpublished explorations
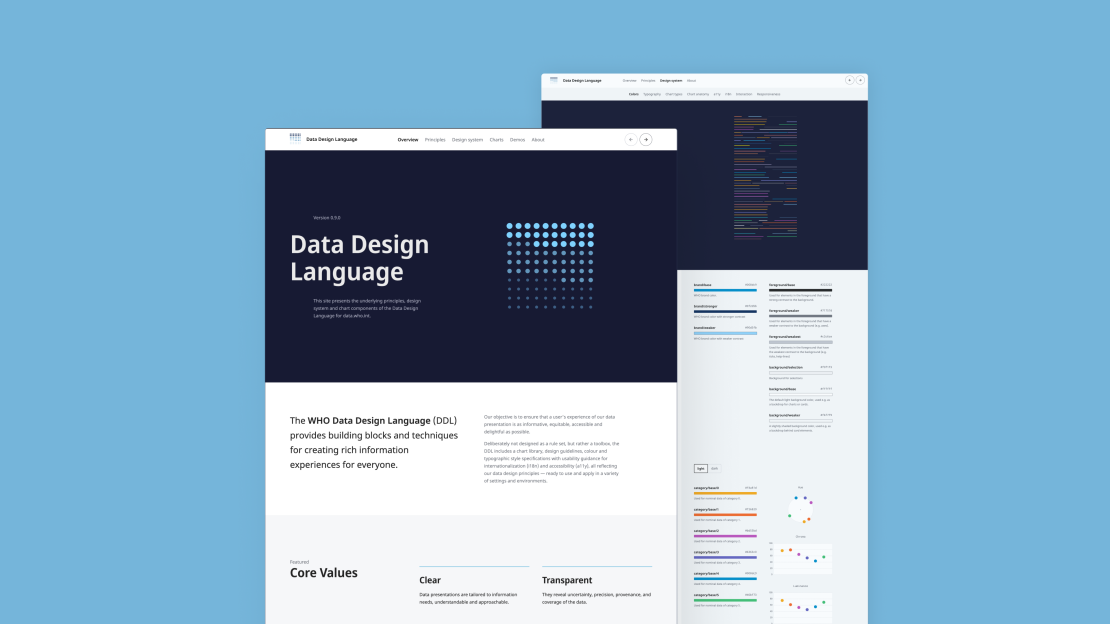
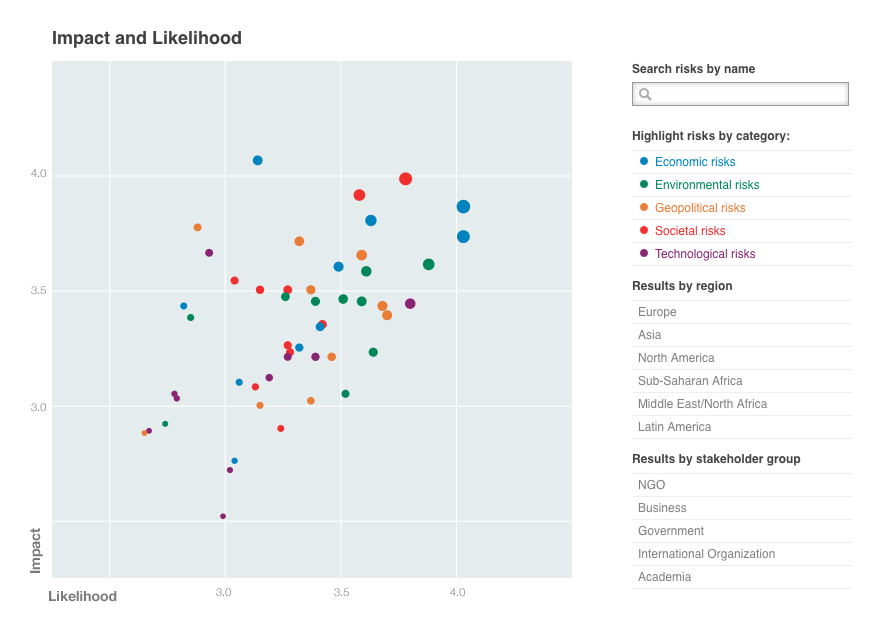
Interactive data exploration interfaces
The online versions of the graphic usually allow a high degree of explorability.
click the images to access the interactive versions
2012
2014 WEF Transformation Maps
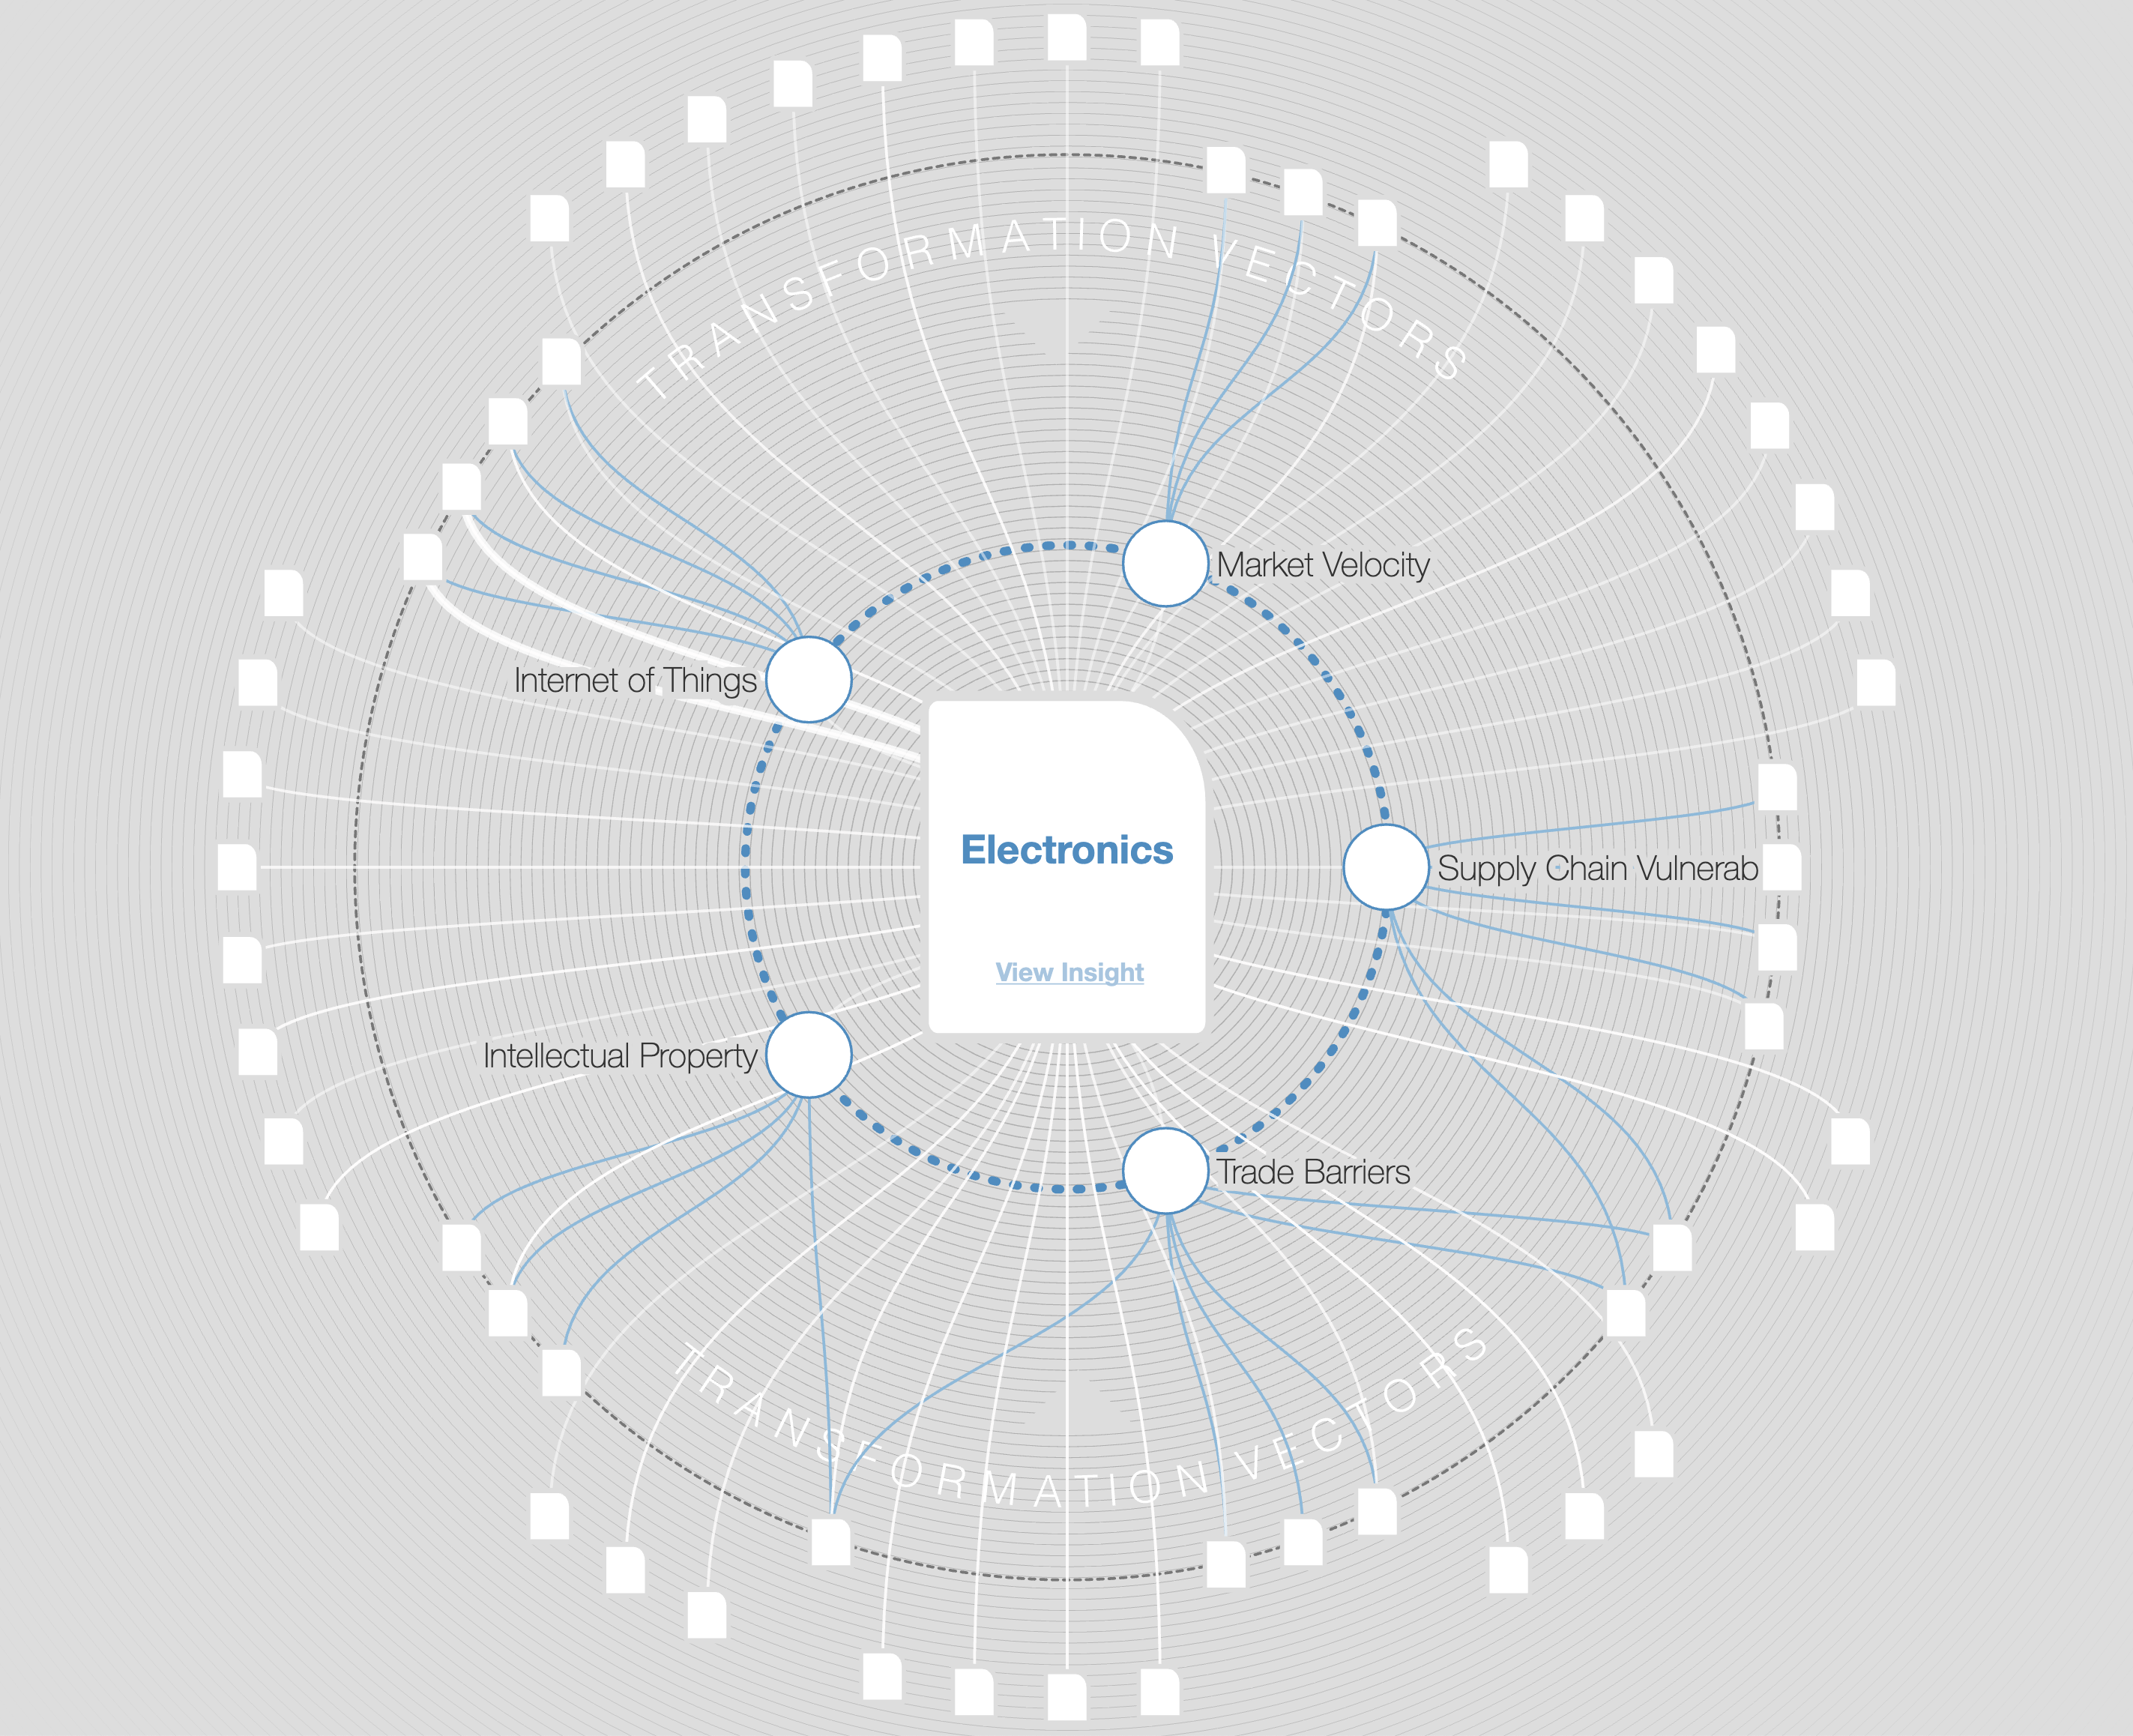
First version of WEF Transformation Maps, together with Dominikus Baur and Scott David
2009 — 2020: Global risk reports
Yearly interactives for global risk report, latest version: